













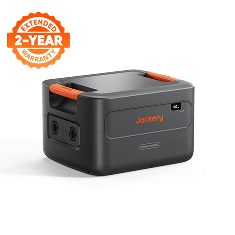
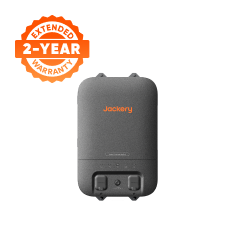



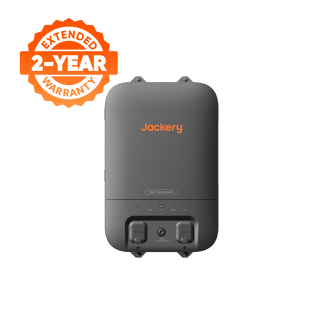
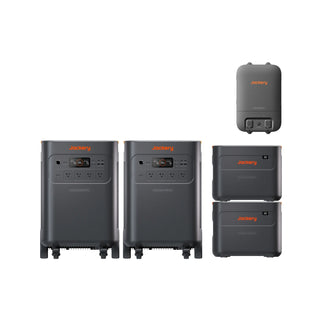
![[Add-on] Jackery SolarSaga 500 X - Jackery](http://www.jackery.com/cdn/shop/files/add-on-jackery-solarsaga-500-x-1493607.webp?v=1786503068&width=324)
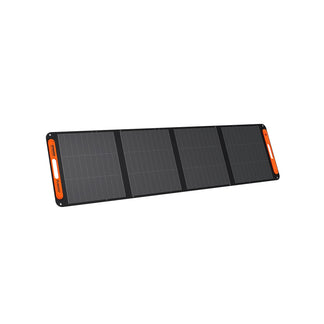
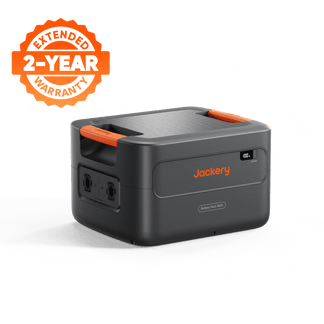
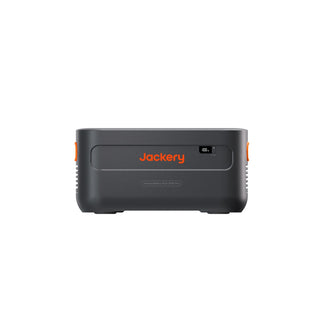
![[Add-on] Jackery Battery Pack 5000 Plus - Jackery](http://www.jackery.com/cdn/shop/files/add-on-jackery-battery-pack-5000-plus-6713401.webp?v=1786503068&width=324)









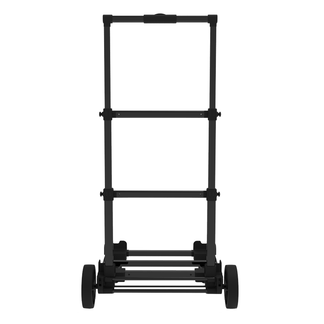


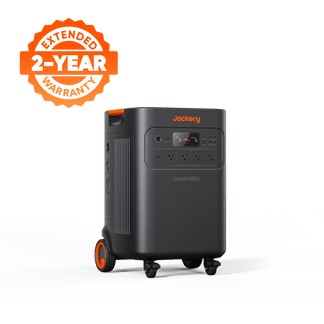
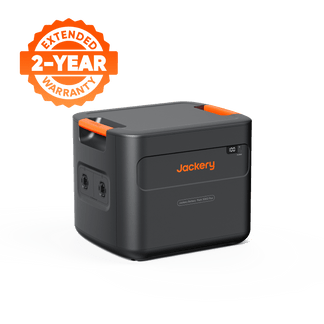
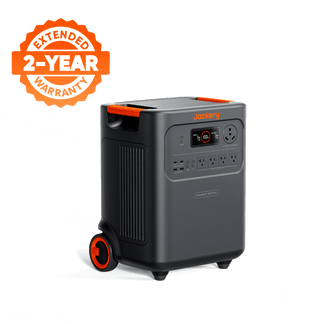



Quick Answer: The typical U.S. home consumes about 29 kWh per day (863 kWh/month), but this number hides enormous variation. A 1,500-square-foot apartment with two occupants might use 10–15 kWh daily, while a 3,000-square-foot all-electric home in Texas with five people can exceed 50 kWh — and spike past 70 kWh during a July heatwave. Your actual number depends on three things: climate, home size, and what you’re powering.
Key Takeaways:
- HVAC systems consume 46–52% of a home's electricity — a 3-ton central AC unit pulls 3.5–5 kWh per runtime hour
- Essential backup loads (fridge, lights, Wi-Fi, phone) require only 3–5 kWh/day; adding a well pump or furnace fan pushes that to 8–12 kWh/day
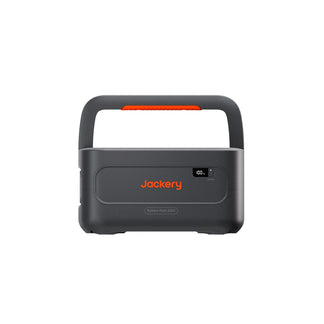
- A 5,040 Wh portable power station covers essential loads for 1–2 days without solar recharge; startup surge handling (7,200W peak) determines whether your AC compressor will actually run during an outage
- Summer cooling spikes daily usage 40% above spring averages in hot climates — size backup for your worst day, not your average
- Track your actual consumption for 7–14 days using your utility's smart meter portal; a $30 plug-in energy monitor identifies the hidden loads driving bill shock
Regional and Seasonal Variation: Why Your “Normal” Is Dynamic
The EIA reports the average U.S. home uses approximately 29 kWh per day — roughly 863 kWh per month. Treat that number as a starting point, not a benchmark that describes your house.
House size and occupancy drive the first layer of variation:
- A 1,500-square-foot home with two people typically lands around 18 kWh per day
- Double the square footage to 3,000 and add three more occupants, and you are often looking at 40 kWh or more before accounting for climate
Regional climate shifts the baseline dramatically:
- Southern states average 37 kWh per day — heavy air conditioning is the dominant load
- Northeast homes average closer to 23 kWh, largely because space heating runs on natural gas or oil rather than electricity
- Hawaii ranks lowest at roughly 17 kWh per day due to mild weather and limited electric heating
Seasonal spikes compound these differences. A Texas home using 35 kWh per day in April can hit 53 kWh in July when the AC compressor runs 12-plus hours — a 51% jump, not a gradual drift. In the Northeast, winter storms combine electric heat, oven use, and extended lighting; a household averaging 20 kWh per day in mild weather can spike to 30-plus kWh during a cold snap.
Size backup for your worst day, not your average. If your July peak hits 50 kWh, plan battery capacity around that number — not the 35 kWh you use in October. A 20 kWh system that handles shoulder seasons collapses during a summer outage when AC is non-negotiable.
What Actually Drives Your Daily kWh: Appliance Deep Dive
HVAC: The Half-of-Your-Bill Problem
Heating and cooling consume 46–52% of household electricity, according to DOE data. A 3-ton central AC unit pulls 3.5–5 kWh per runtime hour. Run it 10 hours on a hot day, and HVAC alone accounts for 35–50 kWh.
A high-efficiency heat pump rated at 18 SEER or higher can save 1,500–3,000 kWh per year compared to an aging 10 SEER unit. That translates to $240–$480 annually in electricity savings at national average rates, according to ENERGY STAR efficiency data. Raising your thermostat from 72°F to 78°F in summer cuts cooling energy use by 25–40% — every degree matters exponentially, not linearly.
Water Heating: The Silent Second Place
Electric water heaters account for 16–18% of household electricity — roughly 3–5 kWh per day for a typical family. According to DOE water heating estimates, heat pump water heaters use 60–70% less energy than standard electric resistance models. Tankless electric units reduce standby losses but demand higher instantaneous power when running. At $0.16/kWh, expect $14–$24 per month for water heating alone.
The Vampire Loads Bleeding Power 24/7
Phantom loads — devices that draw power even when “off” — steal 2–4% of daily usage. Cable boxes, always-on smart speakers, chargers left plugged in, and router/modem combos collectively pull 0.5–1 kWh per day. NREL research found the average U.S. home wastes 200–400 kWh annually to standby power alone.
Key offenders to investigate:
- An old garage fridge from the 1990s consuming over 1,500 kWh/year
- A $30 plug-in energy monitor will tell you within 24 hours whether yours belongs in this category
EV Charging: The Load That Changes Everything
A Level 2 home charger adds approximately 7.5 kWh per hour of charging. A full 60 kWh charge — typical for a 200-plus-mile EV — adds roughly 60 kWh in a single overnight session, doubling the national average household's daily consumption in eight hours.
- If you drive 40 miles daily, budget roughly 10–12 kWh per day for EV charging alone
- The average U.S. residential EV owner increases household electricity consumption by 40–50%, based on driving patterns tracked across multiple regions
Appliance |
Typical Wattage |
Daily Hours Used |
Daily kWh |
|---|---|---|---|
Central AC (3-ton, 16 SEER) |
3,500–5,000W |
6–12 (summer) |
21–60 |
Electric water heater |
4,500W |
1–1.5 (total runtime) |
3–5 |
Refrigerator (new, 18 cu ft) |
150W (running) |
~12 (compressor cycling) |
1.8–2.5 |
Old garage fridge (1990s) |
300W+ (running) |
~12 (compressor cycling) |
3.6–5+ |
LED lights (10 bulbs) |
100W total |
5 |
0.5 |
Wi-Fi router + modem |
10–15W |
24 |
0.24–0.36 |
50" LED TV |
100W |
4 |
0.4 |
Level 2 EV charger |
7,200W |
1.5 (daily commute) |
10.8 |
Tracking Your Own Daily Usage Without a Spreadsheet
Smart Meter Data: Free and Hourly
Most U.S. utilities now provide smart meter portals with hourly consumption graphs. In Texas, SmartMeterTexas.com gives every customer 15-minute interval data.
Log in, pull 7–14 days of history, and note the peaks. The EIA reports that over 70% of U.S. households now have access to smart meter data through utility portals or third-party apps. This is your actual usage pattern — not an estimate, not a neighbor's number, not a national average.
Plug-in Energy Monitors: Appliance-Level Granularity
A plug-in energy monitor ($30–$60) sits between the wall outlet and any 120V appliance. It tracks cumulative kWh and real-time wattage over hours or weeks. Use one on your refrigerator for 24 hours to see actual compressor cycling — typically a 12-hour duty cycle, not 24 hours of full draw.
For 240V loads like AC compressors or EV chargers, you cannot use a standard plug-in monitor. Instead, look for clamp-on whole-home energy monitors that attach to your breaker panel. These identify high-draw circuits and show real-time consumption per breaker.
Manual Tracking for Backup Sizing
For backup power planning, list each appliance's wattage, multiply by estimated daily hours, and sum the results:
(Running Watts × Hours Used) ÷ 1,000 = Daily kWh
Example: A 150W fridge running a 12-hour duty cycle = (150 × 12) ÷ 1,000 = 1.8 kWh per day. The same formula applied to lights, router, phone chargers, and a fan gives you the essential-load baseline. Track for 7–14 days to capture weekday/weekend behavior differences, then average across days.
Common misconception: A 40 kWh daily average does not mean you need 40 kWh of battery backup. In an outage, you shed non-essential loads immediately. Your actual backup target is the subset you cannot live without — not the full house.
How Many kWh Do You Really Need in an Outage?
Backup Tier |
Daily kWh |
What's Included |
Recommended Battery Capacity |
|---|---|---|---|
Essentials-Only |
3–5 kWh/day |
Refrigerator, a few LED lights, Wi-Fi router, phone charging |
5–7 kWh (~24 hours without solar) |
Moderate |
8–12 kWh/day |
Everything above + furnace blower fan (600W), well pump (1,000–2,000W startup surge), or home office equipment |
15–20 kWh (full day without solar recharge) |
Whole-Load |
30+ kWh/day |
Central AC, electric oven, EV charging |
40–60 kWh (covers peak hours when solar input drops) |
The Minimum: Essentials-Only (3–5 kWh/Day)
If you are considering a portable power station for essential home backup, this is the tier that matches real-world fridge-and-lights scenarios.
The Moderate Tier: Adding Furnace, Well Pump, or Home Office (8–12 kWh/Day)
This is where many homeowners with a larger portable backup system find their sweet spot: enough capacity for 24 hours of critical circuits without overspending on storage they rarely use.
The Whole-Load Scenario: AC, Oven, EV (30+ kWh/Day)
Startup surge is the gotcha. A 3-ton central AC compressor draws 5,000–7,000 watts for the first 2–3 seconds during startup — well above its 3,500W running load. The inverter or power station must handle that instantaneous spike, or the compressor never starts. Check surge ratings, not just continuous output.
Sizing Rule of Thumb
Target 1.5× your essential daily kWh to account for defrost cycles, cloudy days reducing solar recharge, or outages that stretch beyond 24 hours. If your essential loads total 8 kWh per day, size for 12 kWh of usable battery capacity.
Jackery Solutions for Real-World Backup Needs
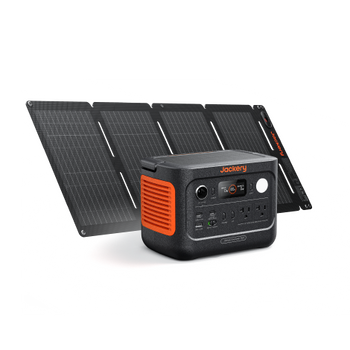
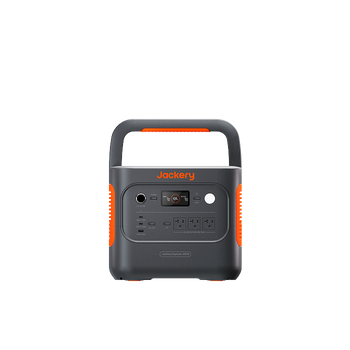
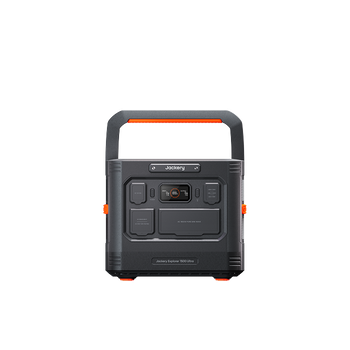
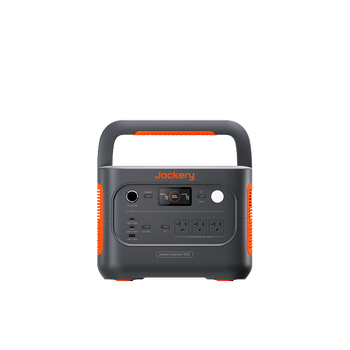
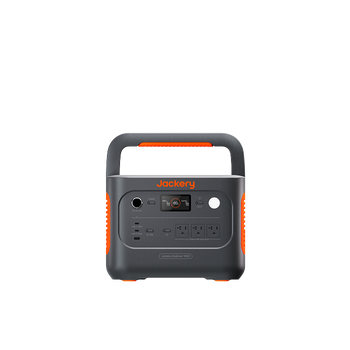
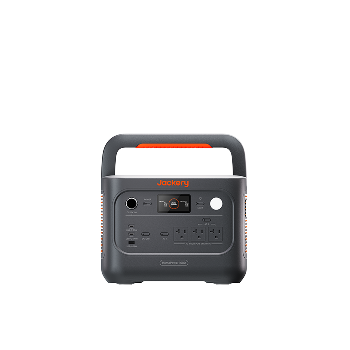
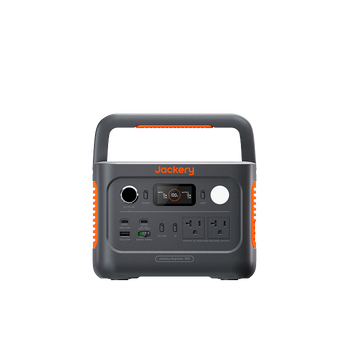
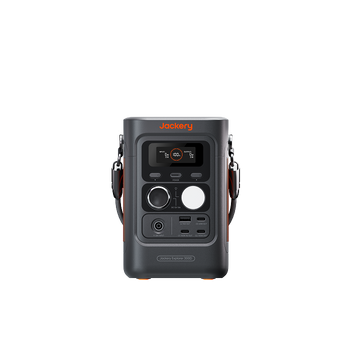
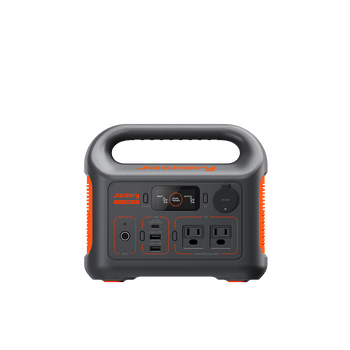
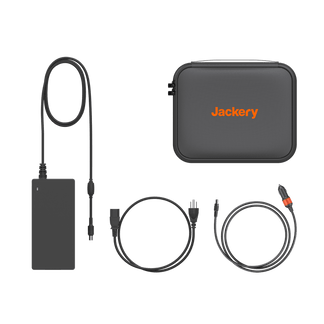
Jackery's portable power stations and solar generator bundles cover the essential and moderate backup tiers discussed above. These are plug-and-play systems — no electrician required for appliance-level backup.
Your Backup Scenario |
Recommended System |
Usable Capacity |
Surge Output |
Continuous Output |
Why It Fits |
|---|---|---|---|---|---|
8–12 kWh/day moderate tier: furnace fan + well pump + fridge + lights + home office — need 1–2 days without solar, and must start a 3-ton AC compressor during summer |
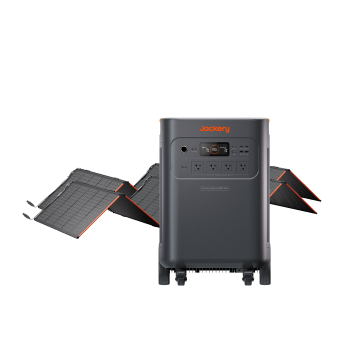
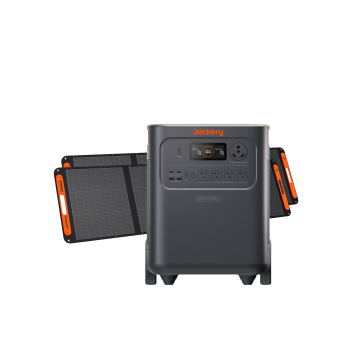
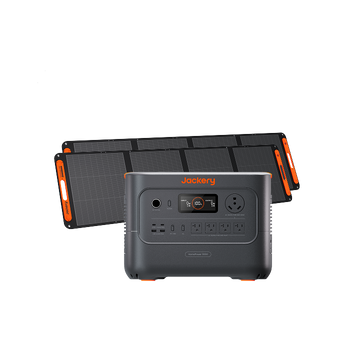
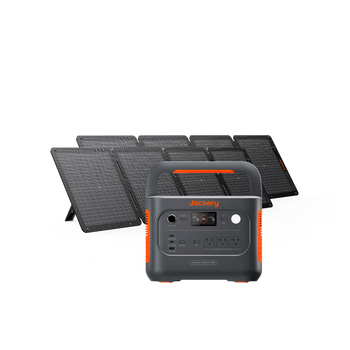
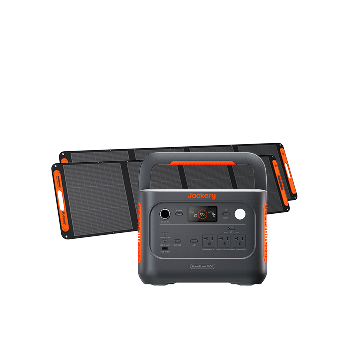
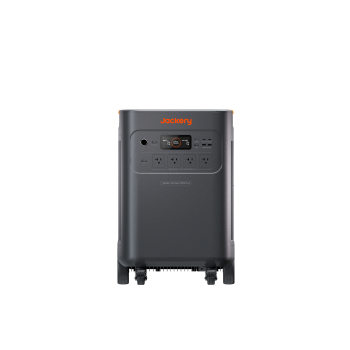
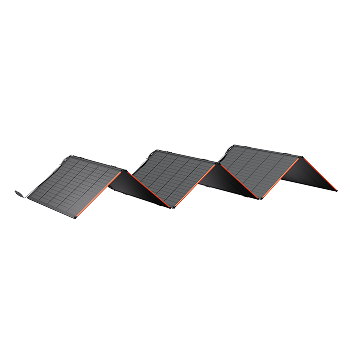
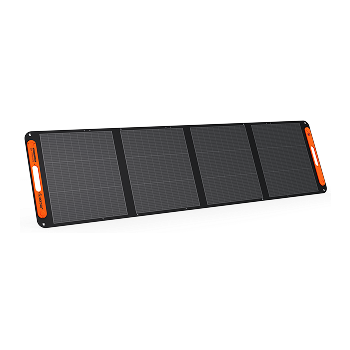
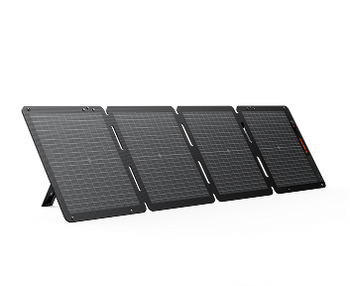
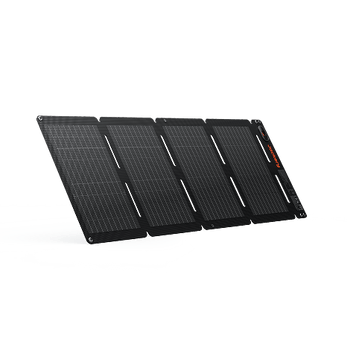
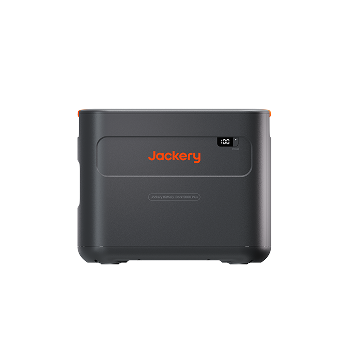
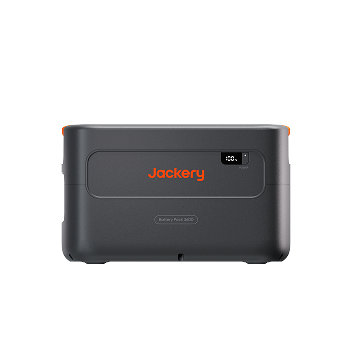
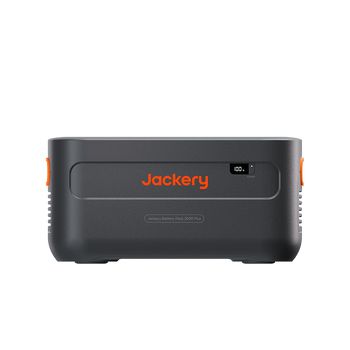
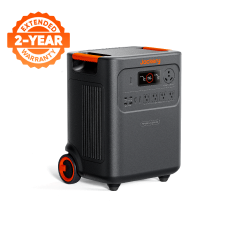
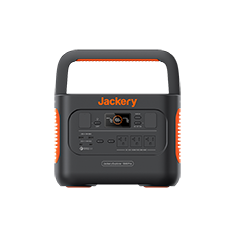
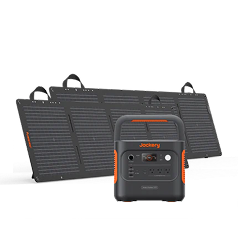
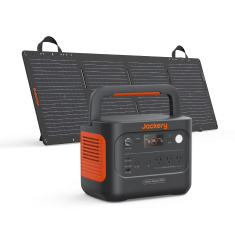
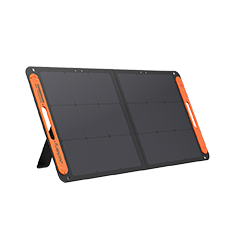
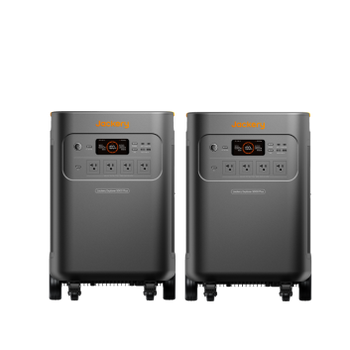
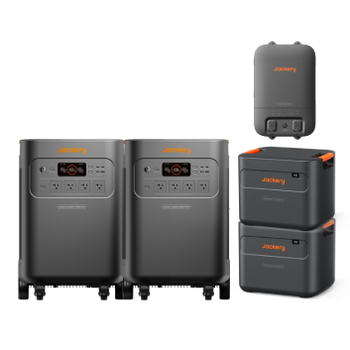
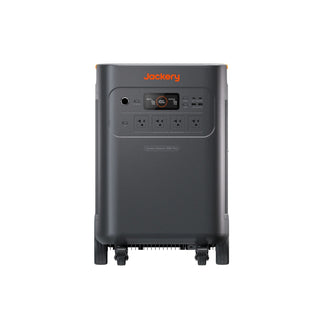
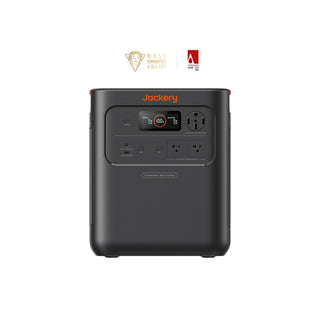
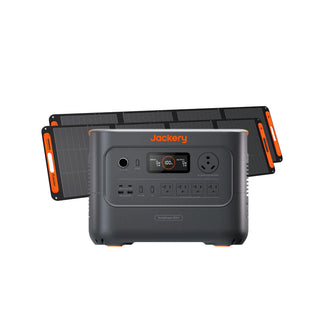
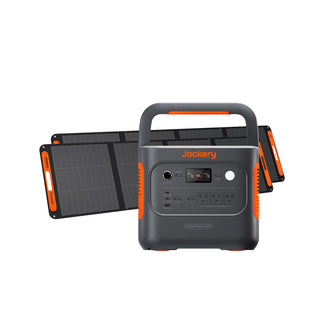
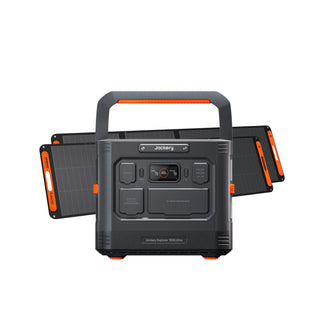
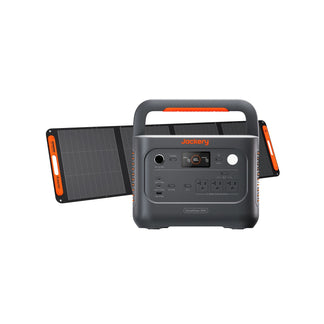
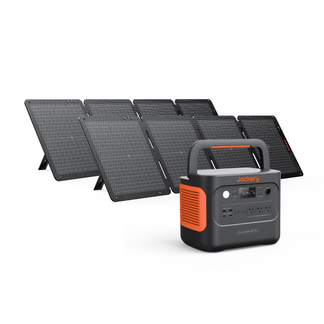
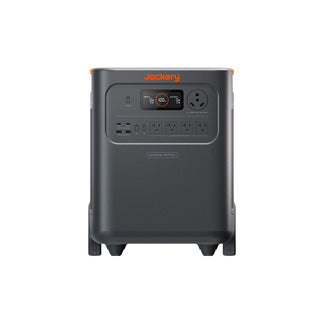
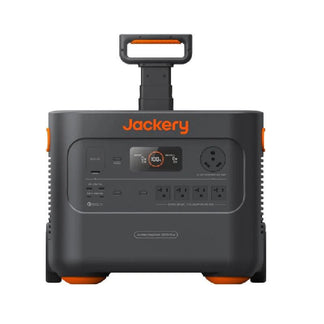
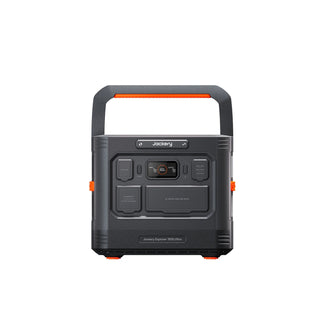
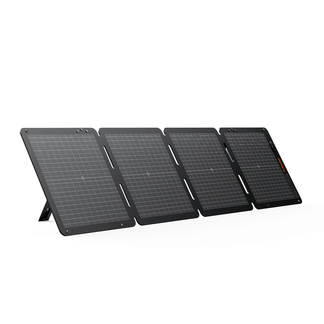
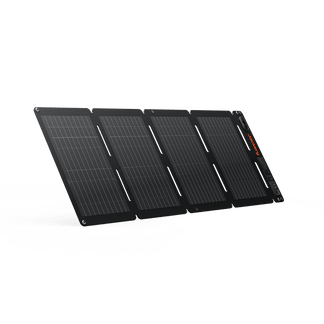
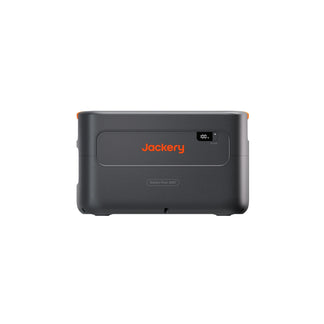
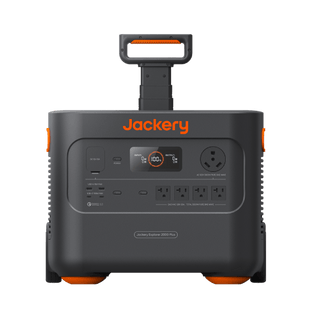
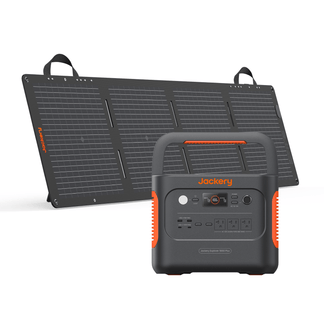
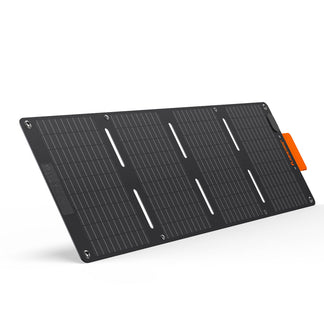
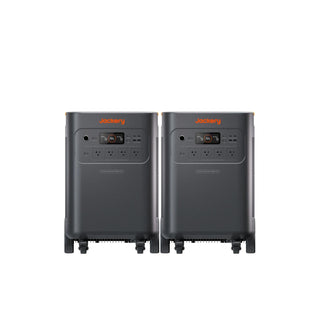
Jackery Solar Generator 5000 Plus + 2× SolarSaga 500X |
5,040 Wh (expandable to 60 kWh) |
14,400W peak |
7,200W |
Handles 7,200W startup surge of a 3-ton compressor — the deal-breaker surge that blocks most inverters — while covering essentials for ~24 hours on one charge |
3–5 kWh/day minimum-to-moderate tier: fridge, lights, router, medical device, home office — need a portable, indoor-friendly unit that can also run a well pump or large appliance |
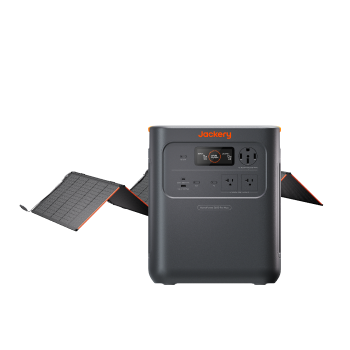
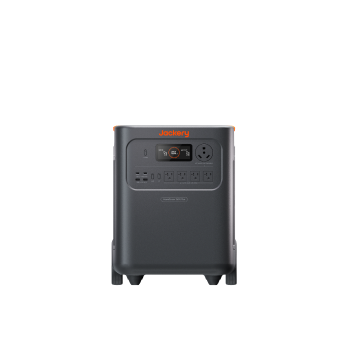
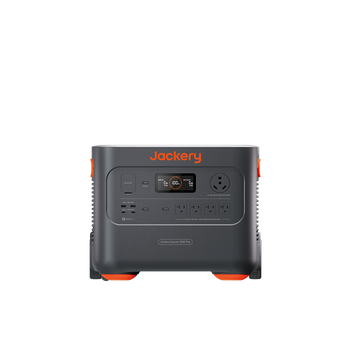
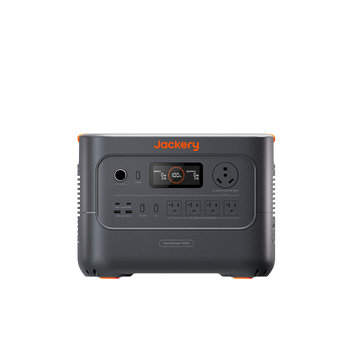
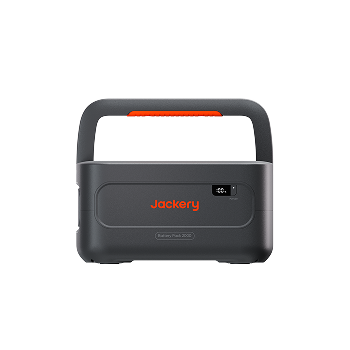
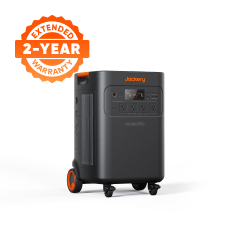
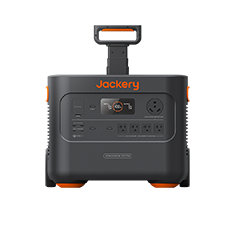
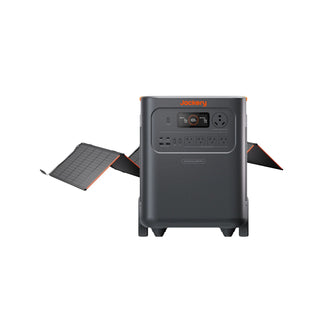
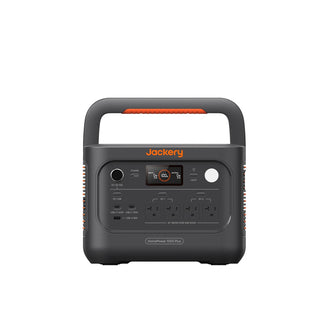
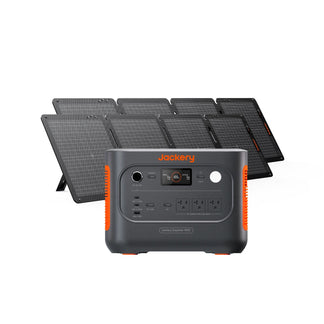
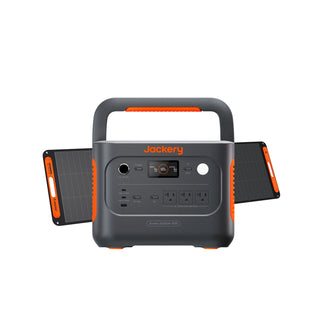
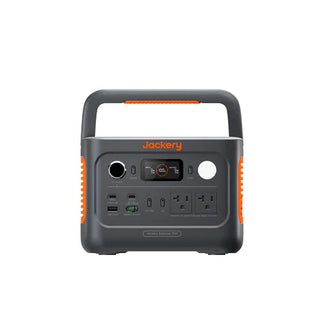
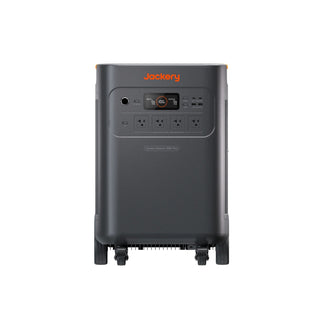
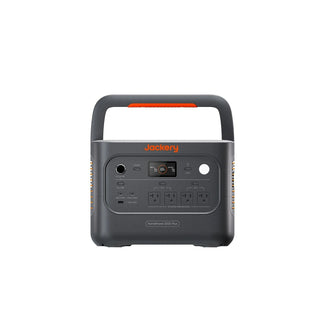
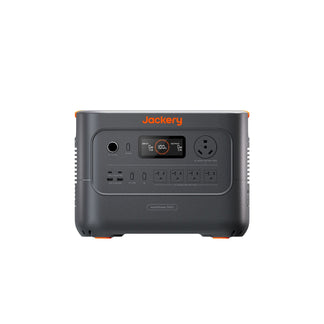
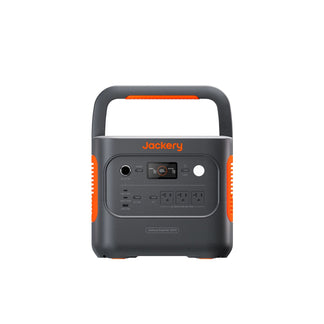
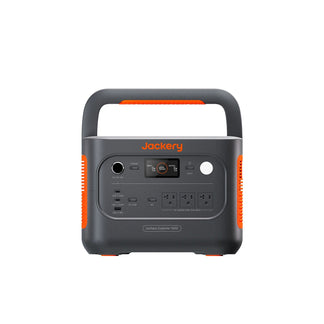
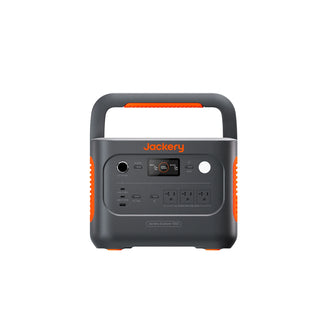
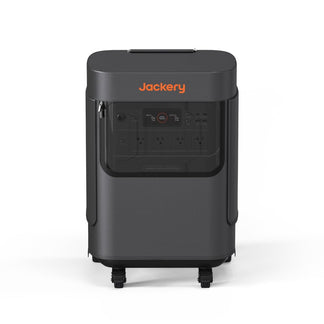
Jackery Solar Generator HomePower 3600 Plus + SolarSaga 500X |
3,584 Wh |
7,200W surge |
3,600W |
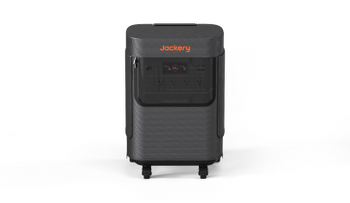
Full day of essentials without solar; trolley design wheels indoors during storms — no extension cords through doorways. For users asking how a portable power station integrates into home and outdoor use, this crosses over to RV trips |
Both systems use LiFePO4 (LFP) batteries: 4,000+ cycles to 70% capacity on the 5000 Plus, 6,000+ cycles on the HomePower 3600 Plus. For AC-heavy summer backup, the 5000 Plus’s 14,400W surge is the deciding factor. For winter storm essentials and portability, the HomePower 3600 Plus delivers the right balance at lower cost and weight.
Frequently Asked Questions (FAQ)
Should I unplug my TV and cable box every night?
Yes — a TV and cable box drawing 25–50 watts in standby costs roughly $35–$70 per year at $0.16/kWh. A smart power strip automates this so you don’t have to remember.
How much does an electric water heater cost per month?
At the U.S. average rate of $0.16/kWh, an electric water heater consuming 3–5 kWh per day costs $14–$24 per month — $170–$290 annually.
Does a ceiling fan really help lower my AC bill?
Yes — running a ceiling fan lets you raise the thermostat by 4°F without losing comfort, cutting cooling energy use by roughly 8–10%. Turn the fan off when you leave the room; it cools people via wind chill, not the room itself.
What is the difference between kWh and kW on my bill?
Kilowatts (kW) measure instantaneous power draw — how fast you are using electricity at this moment. Kilowatt-hours (kWh) measure total energy consumed over time. Think of kW as speed, kWh as distance traveled.


