


















![[Add-on] Jackery SolarSaga 500 X - Jackery](http://www.jackery.com/cdn/shop/files/add-on-jackery-solarsaga-500-x-1493607.webp?v=1786503068&width=324)
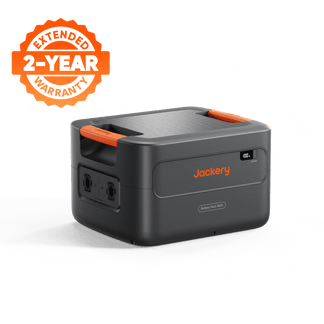
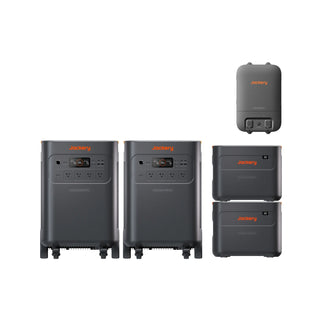
![[Add-on] Jackery Battery Pack 5000 Plus - Jackery](http://www.jackery.com/cdn/shop/files/add-on-jackery-battery-pack-5000-plus-6713401.webp?v=1786503068&width=324)
















How to Interpret a Solar Power Chart for Maximum Efficiency
Quick Answer: A solar power chart displays current-voltage (I-V) and power-voltage (P-V) curves, with the Maximum Power Point (MPP) indicating peak wattage. To maximize efficiency, read the MPP correctly, account for temperature and irradiance effects, and use monitoring to detect shading losses or inverter clipping. Real-world output always differs from STC ratings, and panel efficiency (~20%) is not the same as rated wattage.
Key Takeaways:
- The Maximum Power Point (MPP) on a solar power chart is the single operating voltage where a panel delivers its highest wattage, and MPPT charge controllers track this point automatically.
- Temperature coefficient data on a solar power chart explains why panels produce less power on hot days despite strong sunlight — voltage drops roughly 0.3–0.5% per °C above 25°C.
- Inverter clipping appears as a flattened peak on a daily generation chart and is normal when the DC/AC ratio exceeds 1.2, typically wasting less than 2–5% of annual energy.
- Beginner confusion often centers on distinguishing panel efficiency (~20%) from rated wattage, as efficiency is already baked into the nameplate rating. [1]
- Pain points include misinterpreting production graphs due to missing consumption monitoring (no CT clamps), leading to uncertainty about import/export or self-consumption.
What Is a Solar Power Chart and Why Does It Matter?
A solar power chart is a family of curves showing panel behavior. The I-V curve plots current vs. voltage, with short-circuit current (I_sc) at zero volts and open-circuit voltage (V_oc) at zero amps; the useful operating range lies between them.
The P-V curve plots power vs. voltage, peaking at the Maximum Power Point (MPP), the knee of the I-V curve where current × voltage is highest. MPPT charge controllers track this point continuously.
Fill factor — the ratio of actual MPP to V_oc × I_sc — measures panel quality; 0.75–0.85 is typical for monocrystalline panels, with higher values indicating less internal resistance and better manufacturing. [1]
Standard Test Conditions (STC) set the baseline: 1,000 W/m², 25°C cell, 1.5 air mass — lab conditions. A rooftop in Phoenix might hit 65°C cell temperature and 900 W/m² actual irradiance. Charts must be interpreted with correction factors, never at face value.
A common question: "Is panel efficiency the same as wattage?" No. Efficiency (~20%) is the percentage of sunlight converted to electricity; wattage is output under STC.
A 400W panel with 20% efficiency converts one-fifth of incoming solar energy. Efficiency is already baked into the nameplate — a more efficient panel simply packs more watts into less area. [1]
How Do Temperature and Irradiance Affect Solar Power Chart Readings?
Temperature and irradiance shift the curves in opposite directions.
Temperature kills voltage. For monocrystalline panels, voltage drops roughly 0.3–0.4% per °C above 25°C. At 45°C cell temperature, a panel loses 6–8% of its voltage, shifting the MPP left and reducing peak power proportionally. The temperature coefficient makes this predictable: a -0.35%/°C Pmax coefficient means a 400W panel loses roughly 28W at 45°C: (45 - 25) × 0.35% × 400W = 28W.
Irradiance reduces current proportionally. At 500 W/m² (light cloud), short-circuit current halves, flattening the P-V curve and lowering MPP wattage. Irradiance has minimal effect on voltage until very low levels.
This creates a counterintuitive result: a hot summer day often yields a lower peak on the daily generation chart than a cool spring day with identical sunlight — voltage loss from heat outweighs any current gain from slightly higher irradiance.
Partial shading can create multiple MPP peaks. A single shaded cell in a string can reduce output by 30–50% without functional bypass diodes. Quality MPPT controllers with global scanning can detect the true maximum, avoiding a basic controller locking onto the wrong peak.
The table below shows how temperature affects a typical 400W panel's real-world output:
Cell Temperature |
Voltage Loss |
Power Loss |
Actual Output |
25°C (STC) |
0% |
0W |
400W |
35°C |
3.5% |
14W |
386W |
45°C |
7% |
28W |
372W |
55°C |
10.5% |
42W |
358W |
How to Read a Daily Generation Chart for Efficiency Optimization
Daily generation charts from your inverter or monitoring app show instantaneous power (kW) and cumulative energy (kWh).
Real-time kW is diagnostic. A sudden dip at 2 PM on a clear day points to shading; a gradual decline through the afternoon suggests rising cell temperature; spikes and drops every few minutes indicate passing clouds. This is troubleshooting data.
Daily kWh is the scoreboard. Total energy over 24 hours determines whether your system meets its production target. Compare day-to-day and month-to-month, not minute-to-minute. A 10 kW system in California should produce 35–45 kWh on a clear summer day and 15–25 kWh in winter.
Inverter clipping looks like a flattened peak when DC input exceeds the inverter's AC rating. This is normal — not a malfunction. A DC/AC ratio of 1.2 to 1.4 is standard because panels rarely hit STC; annual energy loss from clipping typically stays under 2–5%.
Missing consumption data is a common pain point. Without consumption monitoring (CT clamps at the main panel), you see only production — not what you used, exported, or imported. This makes self-consumption optimization nearly impossible. A production graph alone cannot tell you whether you're maximizing solar use or sending surplus to the grid.
Experienced advice: simplify your monitoring dashboard. Plot only 2–3 parameters — power, voltage, and temperature — and ignore the rest. A cluttered graph with eight overlapping curves makes actionable insights harder to spot.
What Is the 20% Rule for Solar Array Sizing?
The 20% rule is a practical design guideline: size your solar array to produce roughly 20% more energy than your average annual consumption (target 120% of typical usage) to compensate for real-world losses and future demand.
Real-world losses stack up:
- Inverter conversion: 3–5% loss
- Wiring resistance: 2–3% loss
- Dust and soiling: up to 10% or more between cleanings
- Seasonal variation: winter production may be half of summer's peak
- Panel degradation: 0.5–0.8% per year, compounding to 10–20% capacity loss over 25 years
To apply the rule, start with 12 months of utility bills, find your average monthly kWh, multiply by 1.2 to set the production target, then divide by local peak sun hours to find the required system size in kW.
Example: A household averaging 900 kWh per month in a region with 5 peak sun hours needs: (900 × 1.2) ÷ 30 days ÷ 5 hours = 7.2 kW system.
The 20% buffer also supports future electrification. Adding an EV charger or heat pump later won't require a full system redesign if the array already has headroom. For homeowners weighing the cost of a home backup generator versus battery storage, oversizing the array makes stored solar more valuable during outages.
This rule is a starting point, not a guarantee. Heavy tree shading, poor roof orientation, or local weather patterns can force adjustments. A solar power chart from a site assessment tool like PVWatts provides site-specific estimates that refine the 20% target.
Portable Solar: A Flexible Alternative to Rooftop Arrays
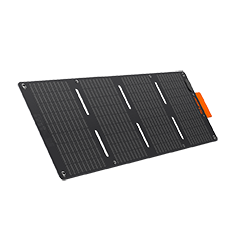
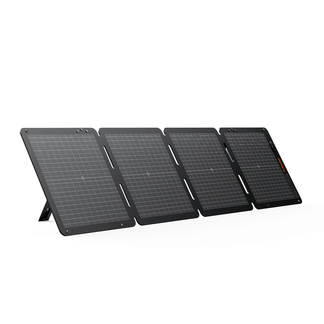
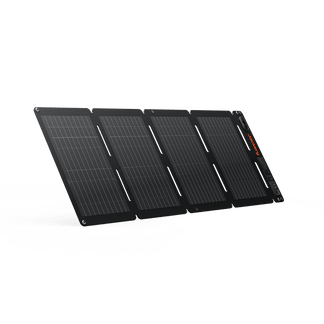
Portable solar panels paired with a power station give renters, condo owners, and those with shaded roofs a flexible, no-install alternative to rooftop arrays. Understanding what a solar generator actually does clarifies why this approach works.
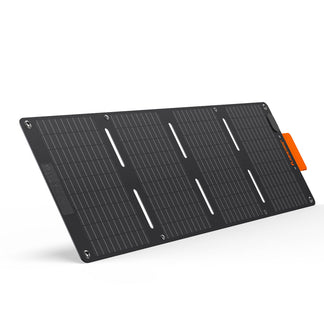
High-efficiency portable panels generate more watts per square foot than budget rigid panels. Bifacial designs capture reflected light from surfaces below, adding 5–15% to output in the right conditions. For a small balcony, yard, or campsite footprint, this density matters.
Pairing portable panels with a power station stores daytime energy for evening use. A 400W portable array charging a 2–5 kWh station provides genuine home backup power for essential loads — refrigerator, Wi-Fi, lights, phone charging — without any roof penetration or permanent installation.
This approach doesn't replace a full rooftop system for whole-home needs. But for essential backup and partial offset, it's a practical entry point. And when you're evaluating which battery backup generator fits your situation, the portability factor adds flexibility that fixed installations can't match.
Limitations / What to Know Before
Solar power charts assume ideal lab conditions. Real-world output is always lower due to temperature, dust, shading, and inverter losses. Never expect STC-rated wattage daily — a 400W panel producing 320–350W on a clear afternoon is performing well.
The 20% sizing rule is a design guideline, not a guarantee. Local conditions — roof orientation, tree shading, microclimate weather patterns — can force adjustments that reduce or eliminate the buffer's effectiveness. A site assessment with actual measurements always beats a rule of thumb.
Production monitoring without consumption data leaves a blind spot. You can see what your panels generate but not where that energy goes. If self-consumption optimization is your goal, install consumption monitoring from day one.
Portable solar cannot match the total output of a rooftop array. A 400W portable setup produces perhaps 1.5–2 kWh on a good day. A 7 kW rooftop system produces 25–35 kWh. The use cases are different — essential backup versus whole-home offset — and confusing them leads to disappointment.
Product Recommendation: Essential Home Backup with Portable Solar
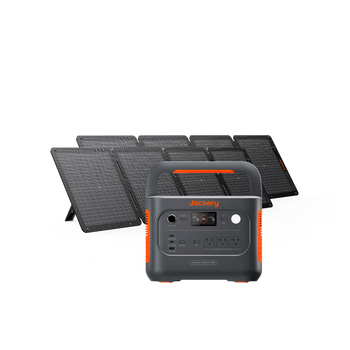
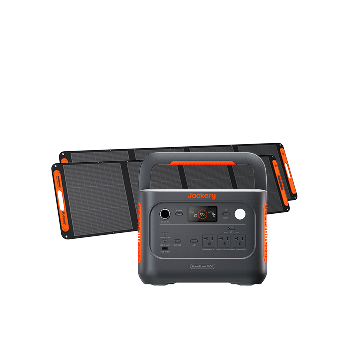
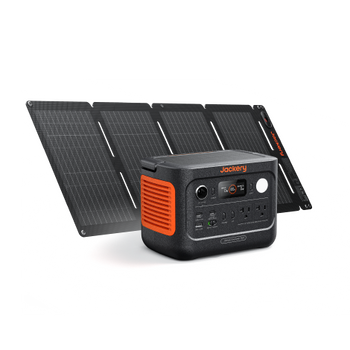
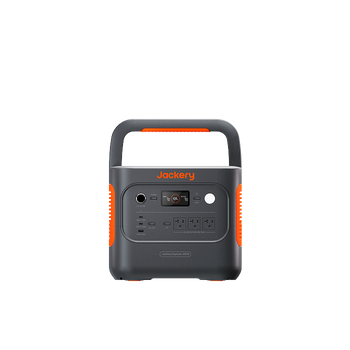
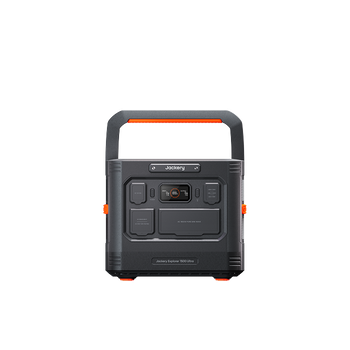
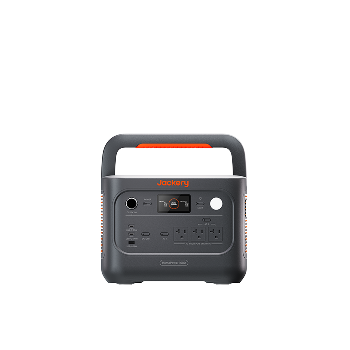
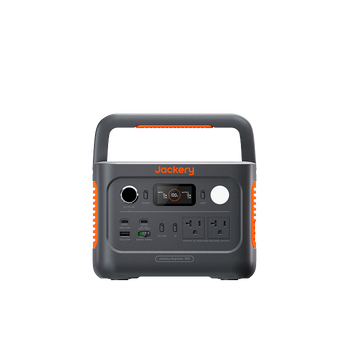
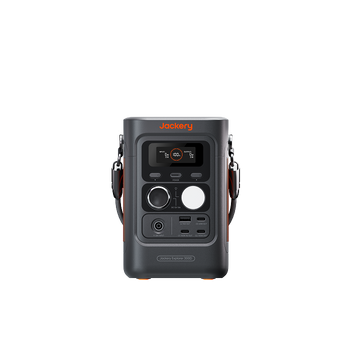
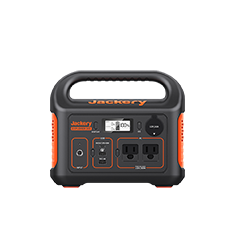
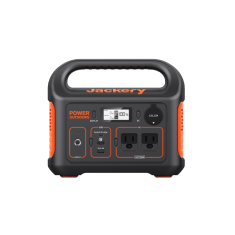
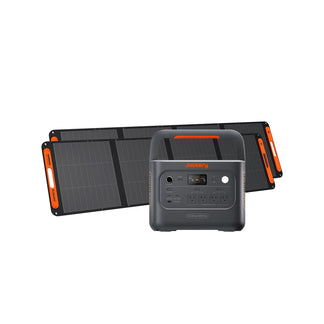
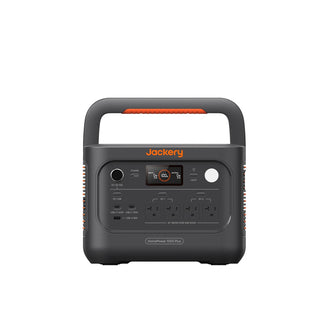
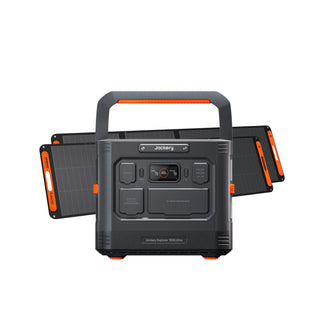
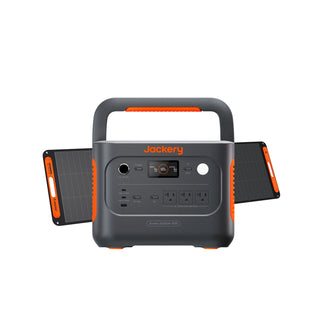
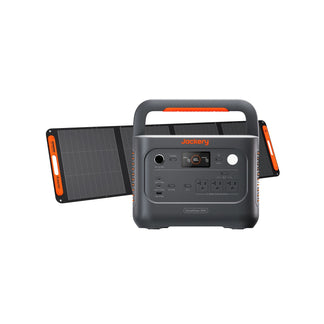
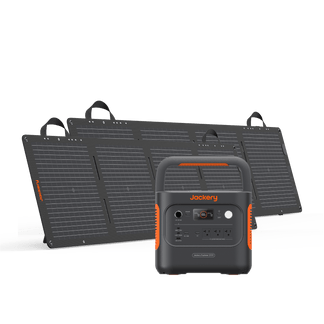
For households that cannot install rooftop solar or want flexible backup power, Jackery's portable solar ecosystem provides a plug-and-play alternative. These systems pair high-efficiency panels with lithium iron phosphate (LiFePO4) power stations for daytime charging and evening use.
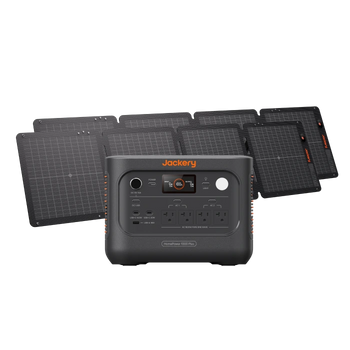
Product |
Key Spec |
Best For |
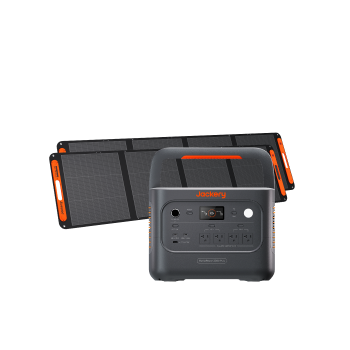
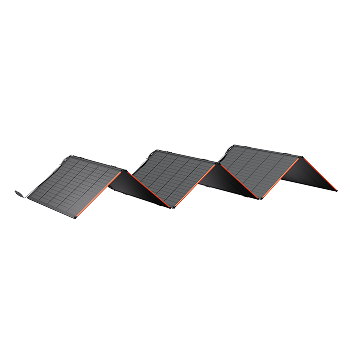
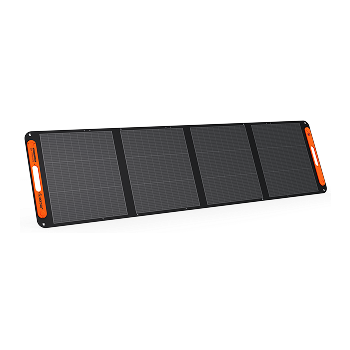
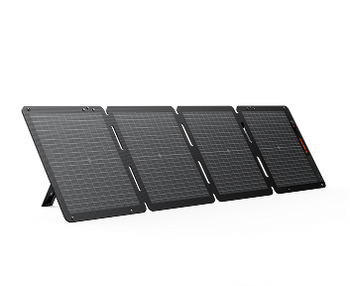
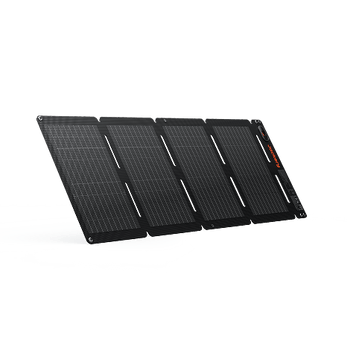
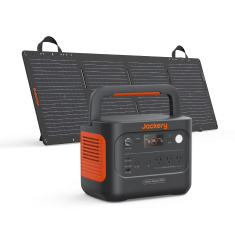
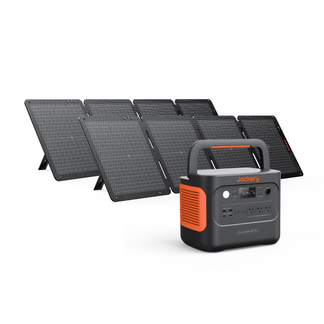
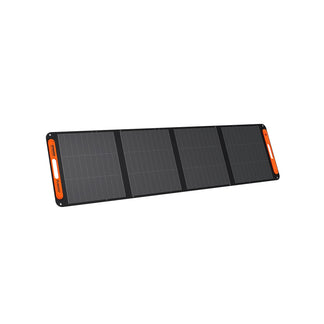
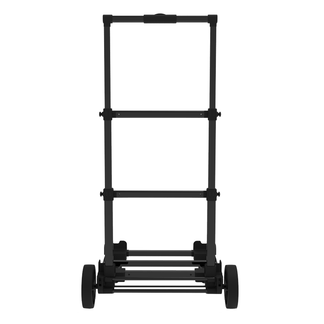
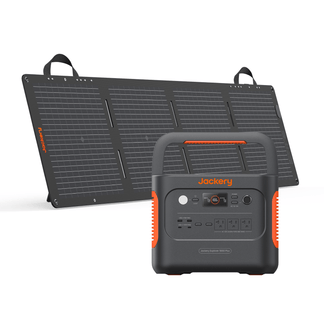
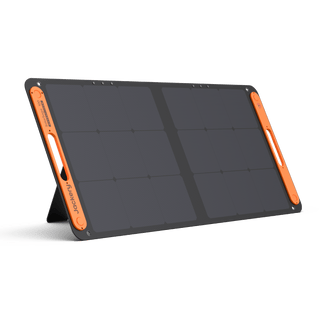
Jackery SolarSaga 500X |
Bifacial 500W panel, IP68-rated |
Balcony, yard, or campsite solar capture |
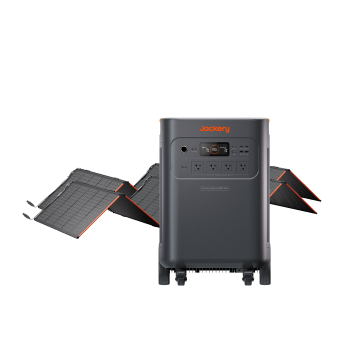
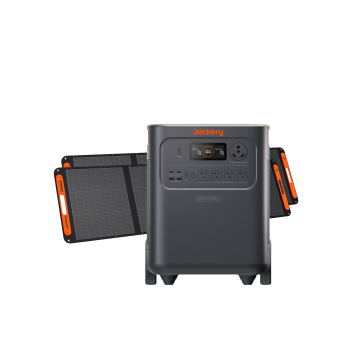
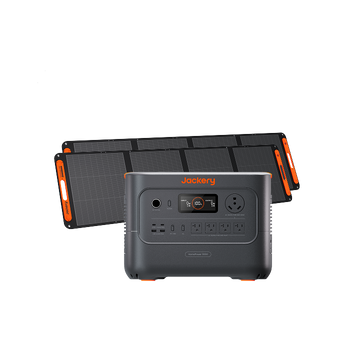
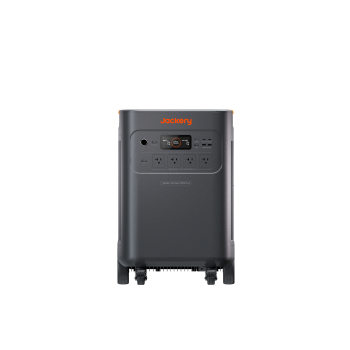
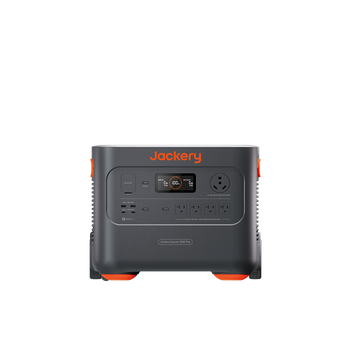
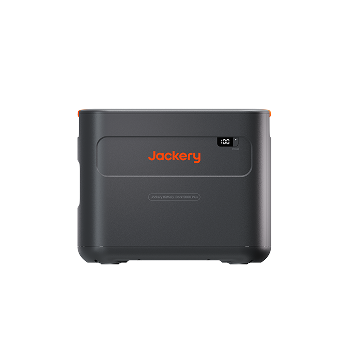
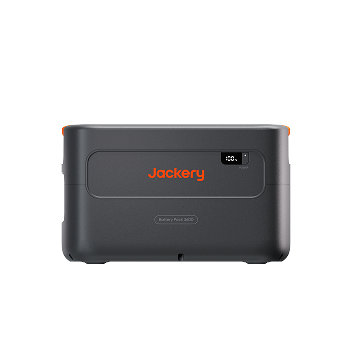
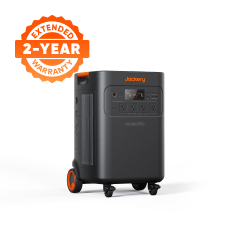
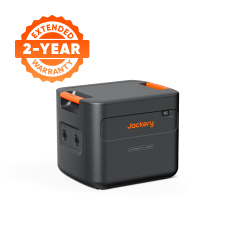
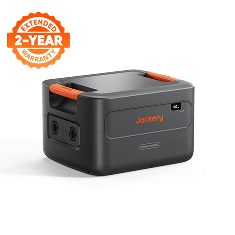
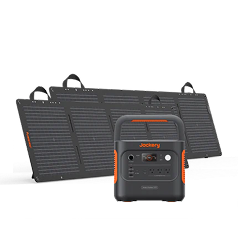
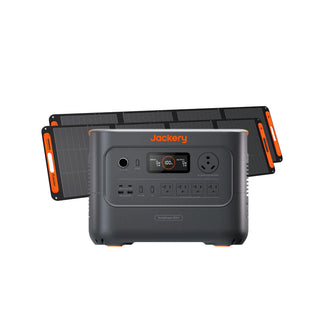
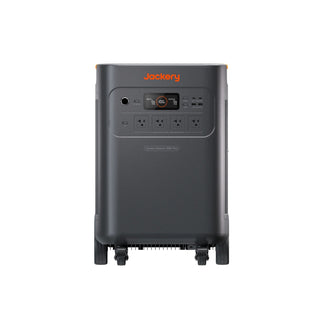
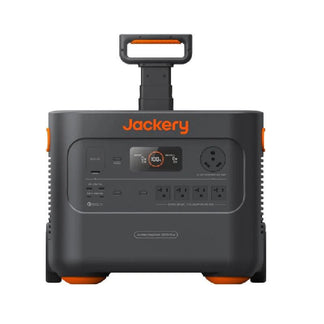
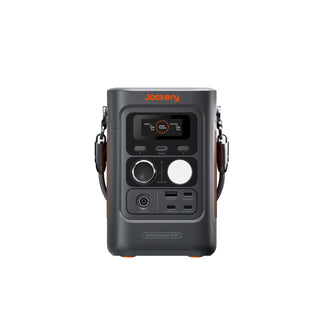
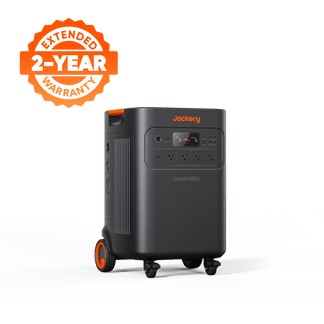
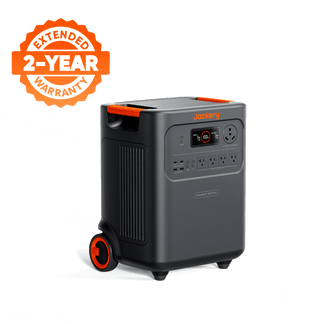
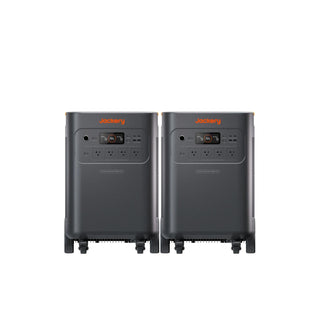
Jackery Solar Generator 5000 Plus + 2x SolarSaga 500X |
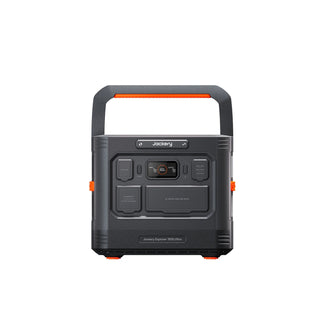
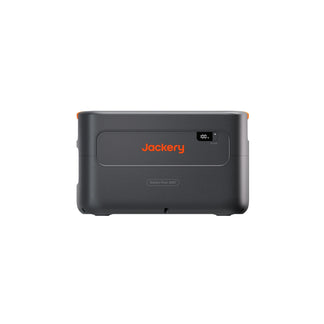
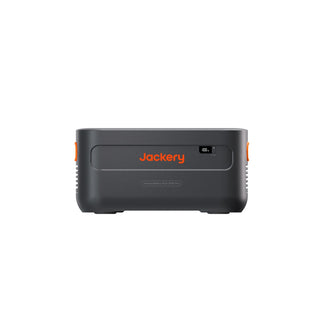
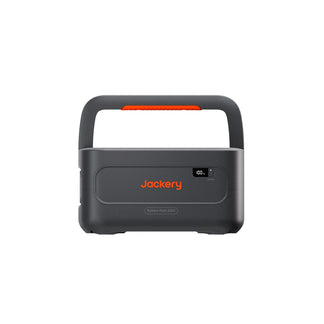
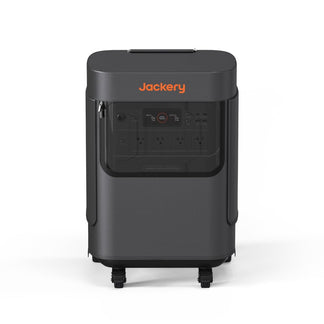
5,040Wh expandable, 7,200W output, 0ms UPS |
Full essential home backup with solar recharge |
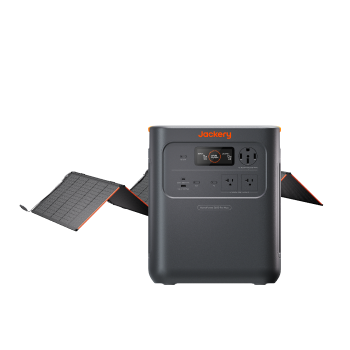
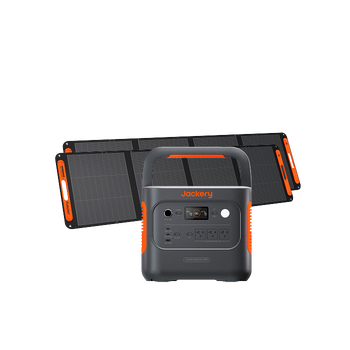
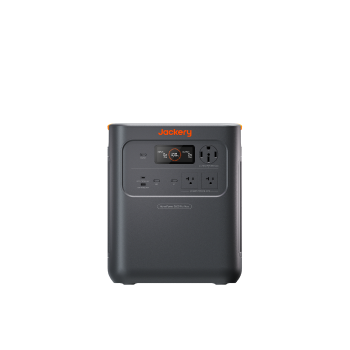
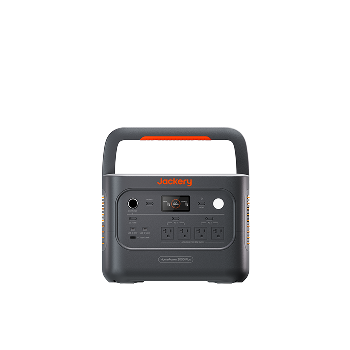
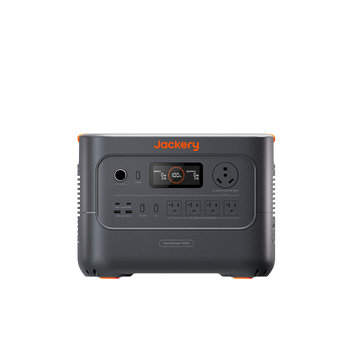
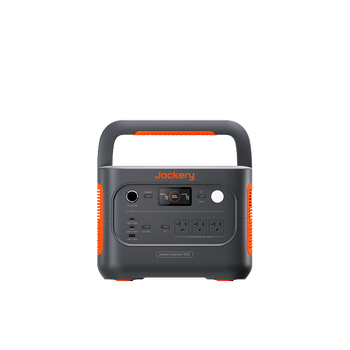
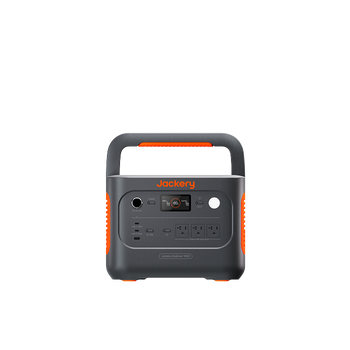
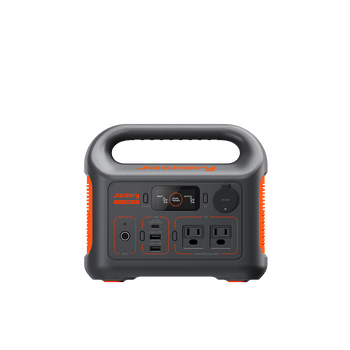
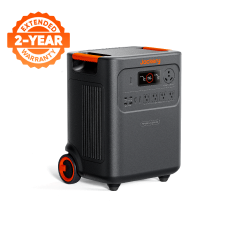
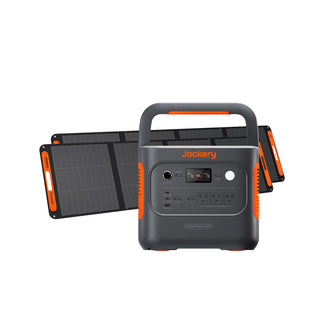
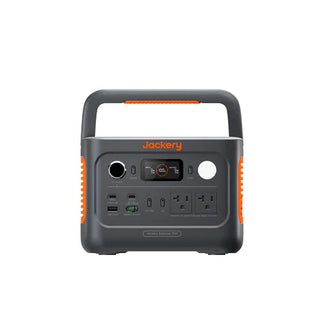
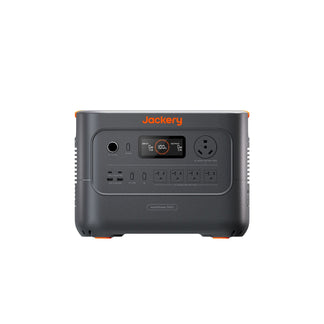
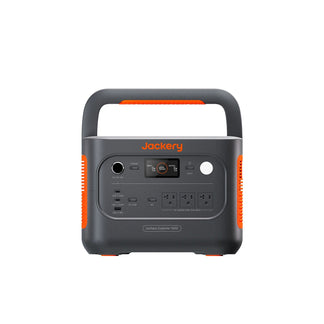
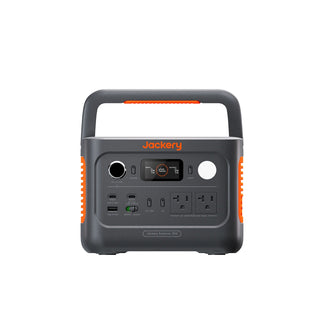
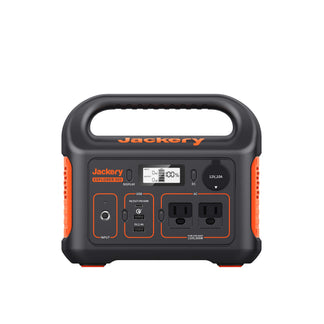
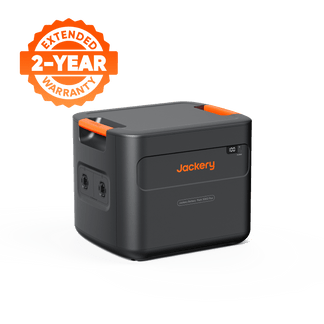
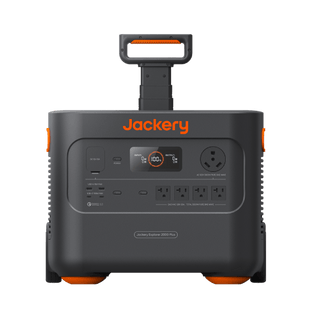
Jackery Explorer 2000 v2 |
2,042Wh, 39.5 lb, 1.7-hr emergency charge |
Lightweight backup for refrigerator and devices |
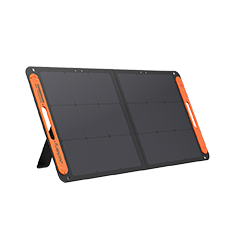
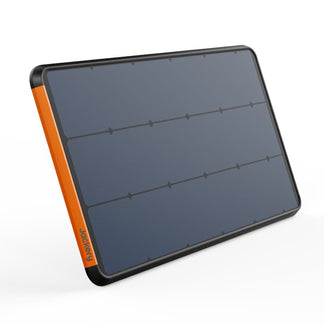
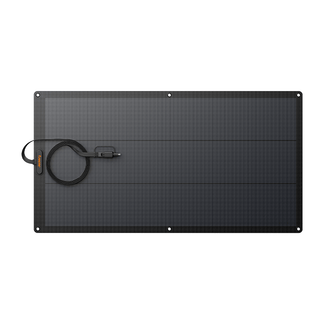
The Jackery SolarSaga 500X leverages the bifacial and no-install benefits outlined earlier. Its IP68 rating handles rain and dust — leave it on a balcony or in the yard without worry.
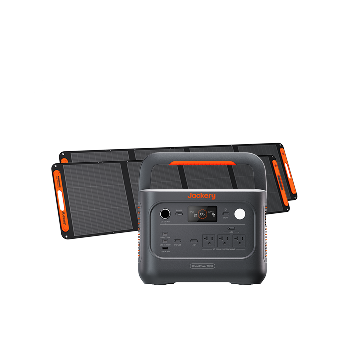
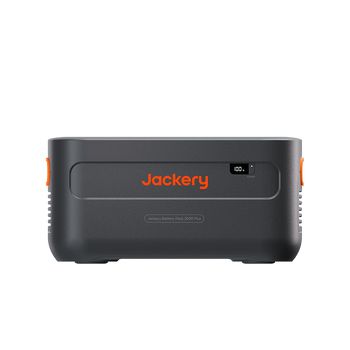
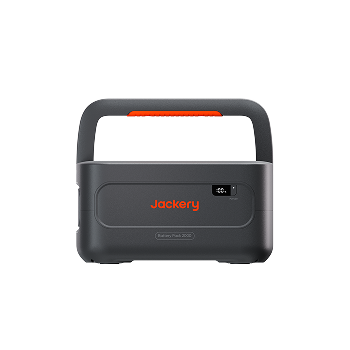
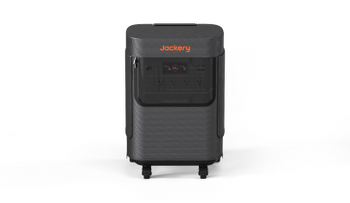
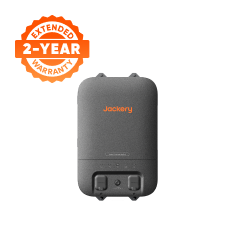
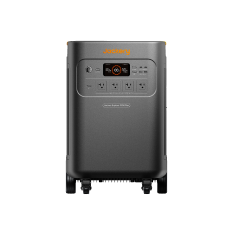
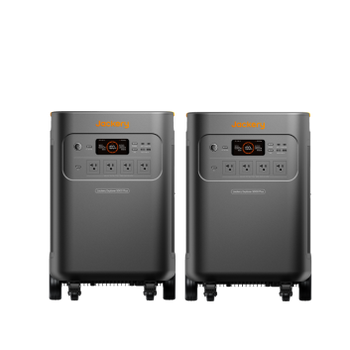
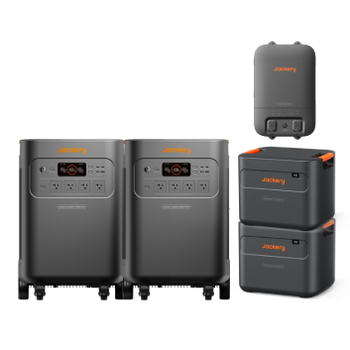
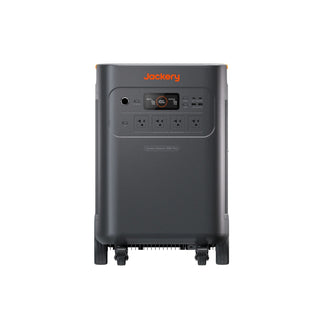
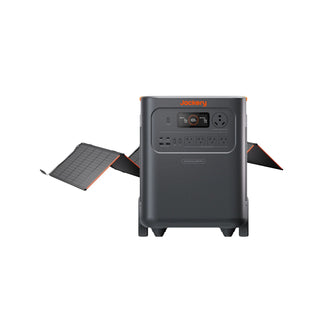
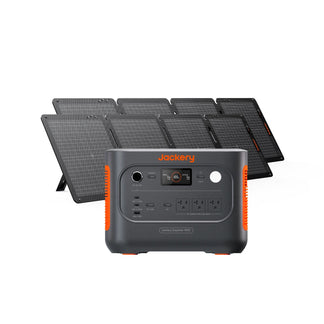
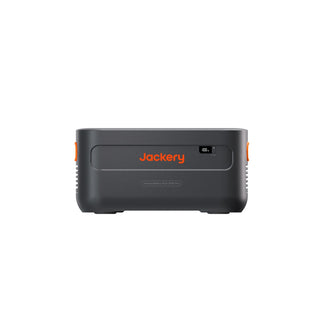
The Jackery Solar Generator 5000 Plus combines two SolarSaga 500X panels with an expandable station:
- Capacity: 5,040Wh, expandable
- Output: 7,200W, 0ms UPS switchover for essential loads
- Solar recharge: ~6.5 hours with both panels
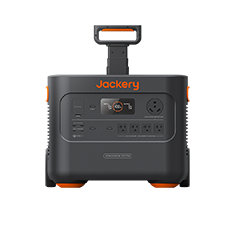
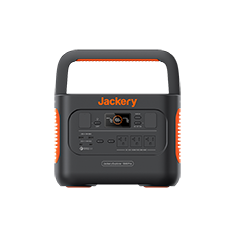
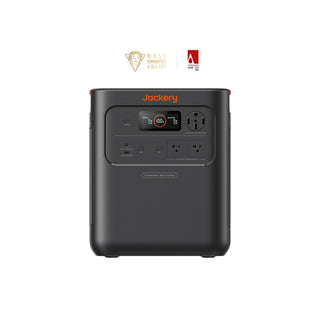
The Jackery Explorer 2000 v2 offers lightweight backup:
- Capacity: 2,042Wh, 39.5 lb
- Runtime: refrigerator 3.2 hours, portable AC 2 hours
- Emergency charge: 1.7-hour super charge from wall outlet
It's the smallest 2kWh backup solution available.
Frequently Asked Questions
What is the performance ratio in solar power charts?
Performance ratio is the ratio of actual energy yield to theoretical yield under STC, typically 75–85% for well-designed systems — accounting for all real-world losses.
How do AI tools detect shading in solar charts?
AI tools analyze I-V curve anomalies and daily generation patterns to identify partial shading, then recommend panel repositioning or bypass diode inspection.
What are the common types of solar power charts?
Common types include I-V curves, P-V curves, daily generation charts, monthly bar charts, and performance ratio trend charts — each serving different diagnostic purposes.
How to calculate system efficiency from a solar power chart?
Divide actual daily kWh by the product of solar irradiance (kWh/m²) and total panel area, then compare to rated cell efficiency to identify underperformance.
What causes a midday dip in solar generation charts on clear days?
A midday dip on a clear day typically results from high cell temperature causing voltage drop, or inverter thermal throttling in hot climates — not shading.
Sources & References
[1] U.S. Department of Energy, "Solar Performance and Efficiency" — https://www.energy.gov/eere/solar/solar-performance-and-efficiency (accessed June 25, 2026).
Disclaimer:
The runtime mentioned for appliances powered by Jackery is for reference only. Actual runtime may vary under different conditions. Please refer to real-world performance for accurate results.

