


















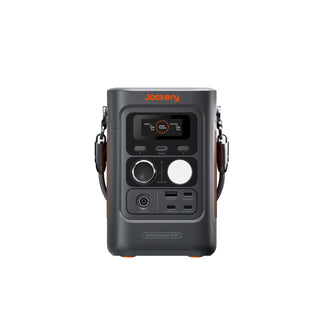

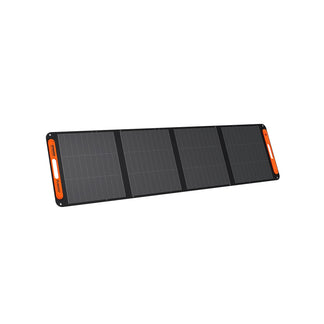
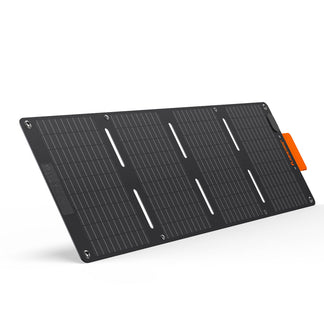
![[Add-on] Jackery SolarSaga 500 X - Jackery](http://www.jackery.com/cdn/shop/files/add-on-jackery-solarsaga-500-x-1493607.webp?v=1786503068&width=324)
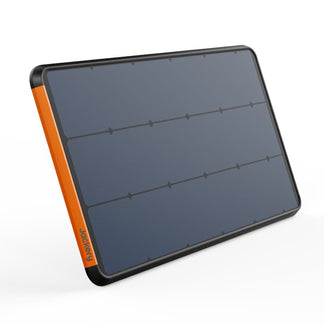

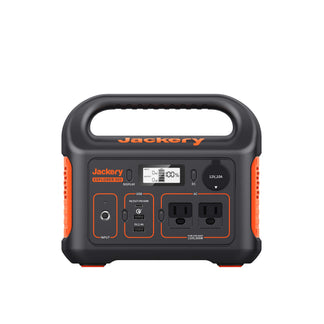
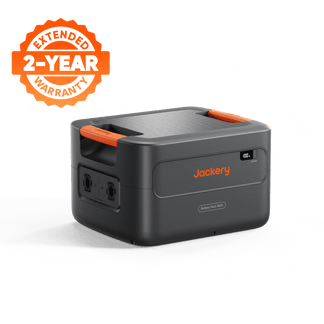
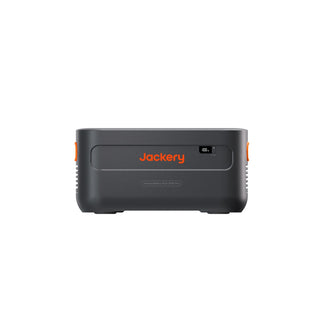
![[Add-on] Jackery Battery Pack 5000 Plus - Jackery](http://www.jackery.com/cdn/shop/files/add-on-jackery-battery-pack-5000-plus-6713401.webp?v=1786503068&width=324)



















Quick Answer:
An average wattage of a house chart shows real‑time electrical draw, with the typical U.S. home averaging 1,200–1,214 watts continuously but spiking over 10,000 watts when heavy appliances start simultaneously. Understanding these peaks and baselines is essential for sizing a backup power system or solar installation correctly.
Key Takeaways
- The average 1,200–1,214 W continuous draw hides surges up to 10,000 W from motor startups, which is critical for sizing backup power systems correctly.
- A high always‑on baseline (e.g., 600 W) often stems from old refrigerators, heat tape, or vampire loads; identify them with a plug‑in energy meter.
- Circuit‑level monitors or utility hourly dashboards reveal specific load patterns beyond a single average wattage number for more precise planning.
- Seasonal HVAC demand can double your average wattage; always review at least 12 months of utility data for a complete picture.
- Never sum breaker ratings to estimate load; use actual measured consumption to avoid overestimating your backup or solar needs.
What Does an Average Wattage of a House Chart Actually Show?
A house‑wattage chart reveals several layers of information:
- Continuous baseline: Every home draws a continuous baseline of 400–800 watts — always‑on loads like refrigerators, Wi‑Fi routers, and idle electronics. Most homeowners are surprised by how high this idle draw is; a decade‑old fridge alone can pull 700 W, while a modern Energy Star model uses only 150 W. Identifying that baseline is the first step to reading a house‑wattage chart.
- Daily patterns: Utility hourly graphs expose daily patterns. You’ll see a morning ramp as appliances kick on, a midday lull, and an evening peak when cooking, lighting, and entertainment converge. The overnight trough often reveals wasted energy — a 100 W vampire load burning 24/7 costs $100–$200 a year, depending on local rates.
- Seasonal shifts: Air conditioning in summer or electric resistance heat in winter can double or triple the average wattage. A 2,000 sq ft Texas home might draw a 1,500 W baseline in August but only 900 W in October, solely because of cooling demand.
- Watts vs. watt‑hours: Watts measure instantaneous power (like speed), while watt‑hours measure total energy consumed (like distance). A chart showing 1,200 W at 2 p.m. doesn’t tell you how many kilowatt‑hours you used that day; it’s a snapshot, not a total.
How to Identify Peak Usage Spikes and Surge Events
Most spikes come from motor‑driven appliances. Starting watts (inrush current) can be 2–3 times the rated running watts for the first second or two. A central AC compressor that runs at 3,000 W may surge to 9,000 W at startup; a well pump that runs at 1,500 W can spike to 4,500 W. This momentary demand is invisible on a 1‑hour utility graph but critical for backup‑system sizing.
Common spike sources include:
- Central AC: 3,000–5,000 W start
- Microwave: 1,000–1,500 W
- Hair dryer: 1,500–1,800 W
- Well pump: 1,500–3,000 W
When two or three of these start simultaneously, a home can push past 10,000 W even though the average chart never shows it. A Level‑2 EV charger adds roughly 7,200 W of continuous demand, potentially doubling peak household load during charging sessions.
To catch these surges, a clamp‑on meter captures momentary inrush peaks that smart meters miss with 1‑hour granularity. Utility data with 15‑minute intervals gives better peak‑data resolution, but only a high‑speed recording meter will show the full inrush magnitude.
What Factors Influence Your Home’s Average Wattage the Most?
Several factors most influence your home’s average wattage:
- Climate and HVAC type: Electric resistance heat can triple winter wattage compared to a heat pump, which uses 40–60% less power for the same heating output. In cooling‑dominant regions, the air conditioner is the single largest variable.
- Home size and insulation: Demand directly correlates with square footage and sealing quality. A 3,000 sq ft, poorly sealed house requires far more power than a 1,500 sq ft tight envelope. Old single‑pane windows and inadequate attic insulation force the HVAC to run longer and harder.
- Appliance age and efficiency: An old refrigerator drawing 700 W continuously consumes 6,132 kWh per year — more than a modern 150 W unit (1,314 kWh) and a 28‑cubic‑foot Energy Star model (600 kWh) combined. The difference adds over $500 annually to the electric bill at $0.15/kWh.
- Number of occupants: Adds roughly 800–1,200 kWh per person annually from electronics, laundry, and cooking activity. A family of four simply has more lights on, more devices charging, and more showers needing hot water.
- Regional climate differences: The table below translates monthly consumption into average continuous wattage.
State |
Avg. Monthly kWh (2024) |
Equivalent Continuous Wattage |
California |
571–729 |
793–1,012 W |
Texas |
1,176 |
1,633 W |
Data source: U.S. Energy Information Administration, Residential Energy Consumption Survey [1].
How to Calculate Your Own Home’s Wattage Requirements
To calculate your home’s wattage requirements, follow these steps:
- Step 1: Inventory major appliances. Note nameplate wattage from labels, then verify with a plug‑in meter (e.g., Kill‑A‑Watt) for accurate per‑device readings — nameplate ratings are often higher than real‑world consumption.
- Step 2: Distinguish starting watts from running watts. For motor‑driven loads, a refrigerator that runs at 150 W may need 450 W for a split second. If your backup system can’t handle that surge, it will trip.
- Step 3: Calculate daily kWh per appliance. Use the formula below, then sum all loads.
(Running Watts × Hours Used) ÷ 1,000 = Daily kWh
Example: A 150 W refrigerator running 8 hours (compressor cycle) uses (150 × 8) ÷ 1,000 = 1.2 kWh per day.
- Step 4: Sum all daily kWh to get total daily watt‑hours.
- Step 5: Add a 20% safety margin to your calculated load to accommodate future additions like an EV charger, heat pump, or expanded home office.
- Step 6: Verify against utility bills. Divide monthly kWh by 30 days and 24 hours to confirm your calculated average wattage roughly matches real consumption.
For a quick sanity check, a home consuming 900 kWh per month averages 900,000 Wh ÷ 720 hours = 1,250 W continuous, which lies squarely in the typical range.
How to Use Wattage Charts for Backup Power and Solar Sizing
Use wattage charts to properly size backup power and solar systems by focusing on the key parameters:
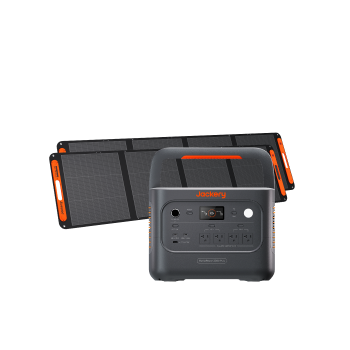
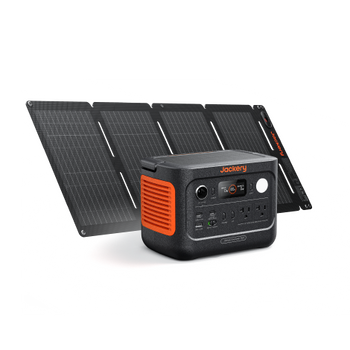
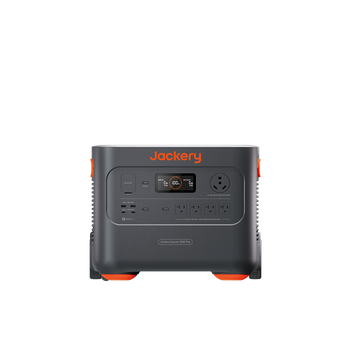
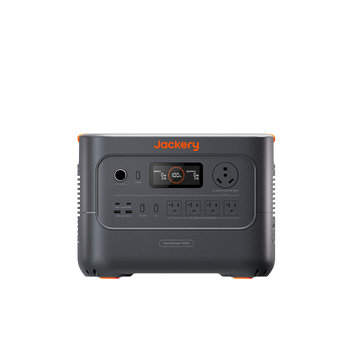
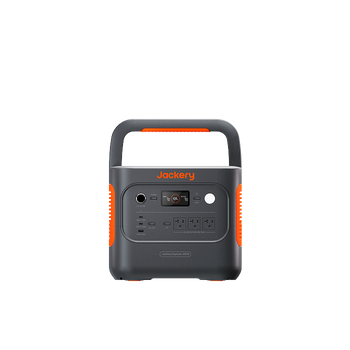
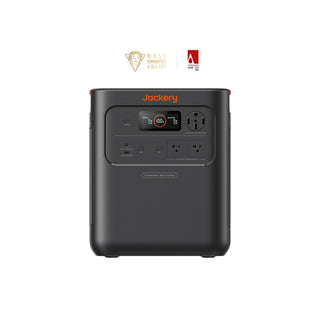
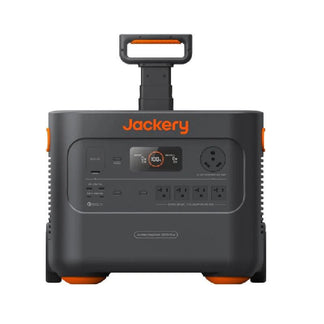
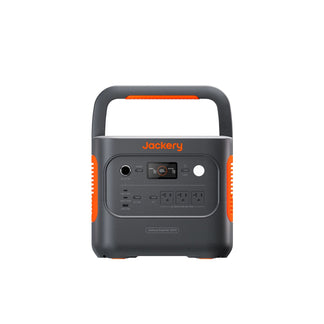
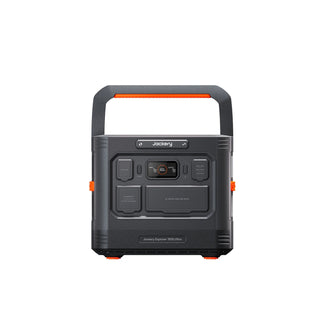
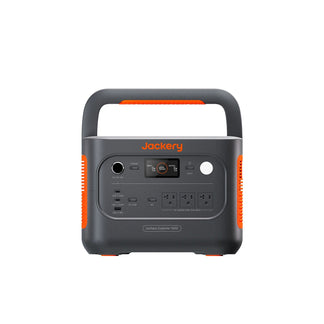
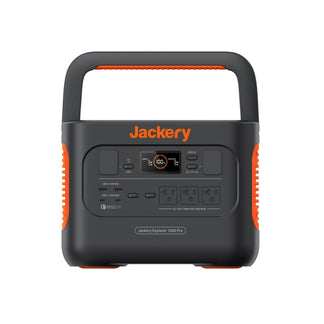
- Essential load prioritization: Typically requires 1,500–3,000 running watts for a refrigerator, lights, Wi‑Fi, and a portable AC during outages. A portable power station like the Jackery Explorer 1000 v2 can handle a subset of these loads, but sizing must account for surge.
- Generator sizing: For a 2,000 sq ft home, generally recommend 15,000–20,000 W of capacity to safely handle central AC and concurrent heavy appliances — far above the 1,200 W average; the chart’s spikes dictate the generator size.
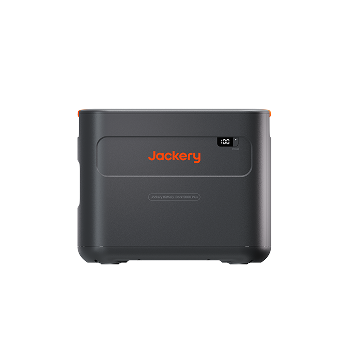
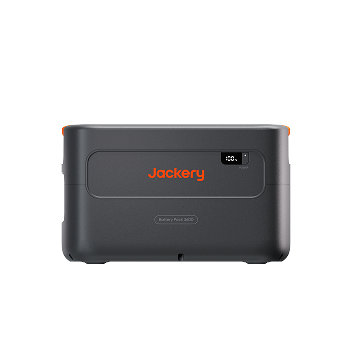
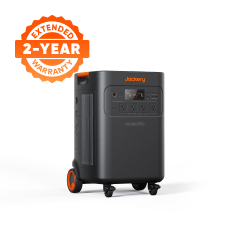
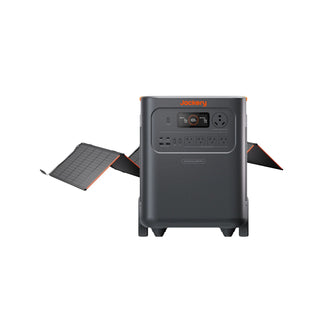
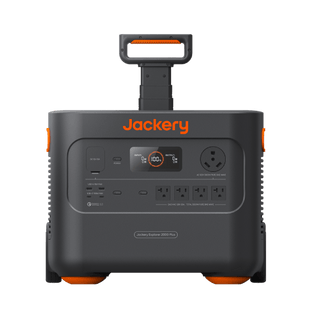
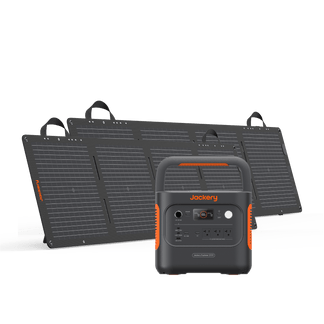
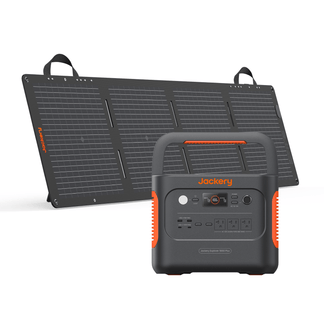
- Battery system capacity: Target daily watt‑hours of essential loads, not peak watts. A home peaking at 5,000 W may only need 5–10 kWh for overnight backup. The Jackery Solar Generator 2000 Plus with its expandable battery pack can cover a refrigerator, networking gear, and lights for a day, but you’ll need to tally watt‑hours carefully.
- Solar array sizing: Divide annual kWh by local peak sun hours using the formula below.
(Daily kWh) ÷ (Peak Sun Hours) = Required System kW
A home consuming 10,500 kWh yearly (28.77 kWh/day) in a 5‑sun‑hour region needs roughly a 6–7 kW system.
- Future‑proofing: An EV charger alone adds 7,200 W of peak demand, which can push you into a larger inverter or battery.
Limitations / What to Know Before
- A single average wattage figure conceals critical spikes. Your home averaging 1,200 W could surge to 10,000 W, which directly impacts generator sizing decisions.
- Nameplate wattage ratings are often higher than real‑world consumption. A microwave labeled 1,500 W may actually draw only 1,100 W during operation.
- Seasonal extremes drive summer or winter wattage 2–3 times above the annual average. Sizing backup for the average leaves you underprepared for the hottest or coldest days.
- Do not sum breaker handles for load estimation. Always use actual measured data from plug‑in meters or utility dashboards to avoid overestimating.
- Hidden always‑on loads like old appliances, attic lights, and vampire draws from electronics add up silently. A circuit‑level monitor is the only way to expose them.
Product Recommendation: Essential Home Backup with Jackery
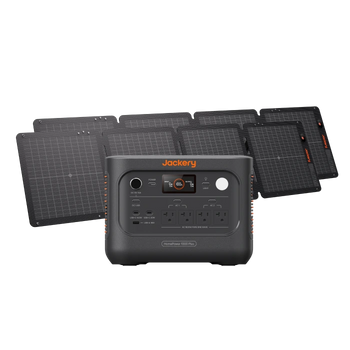
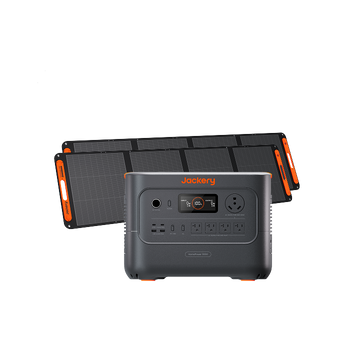
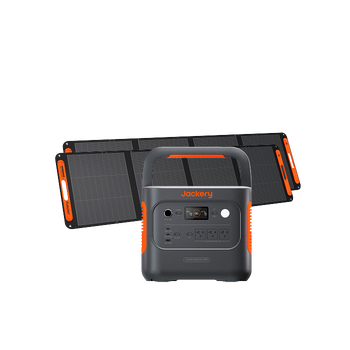
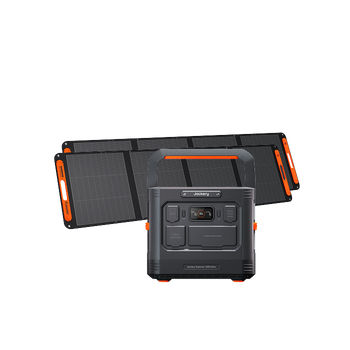
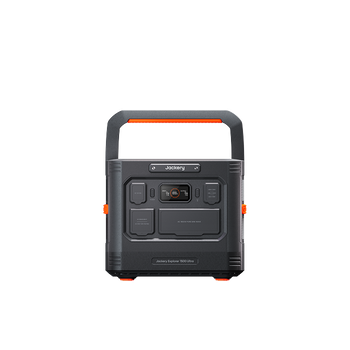
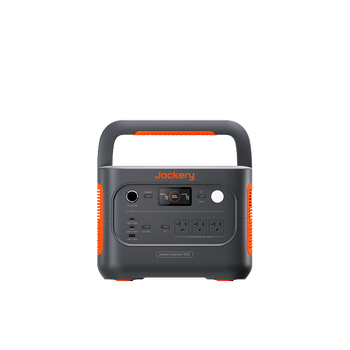
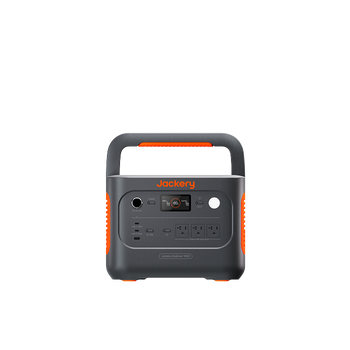
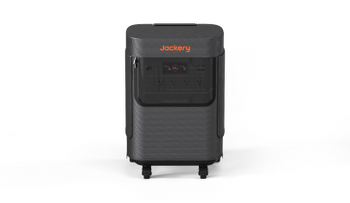
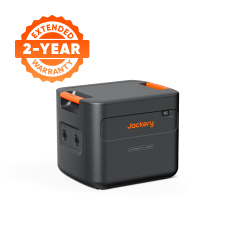
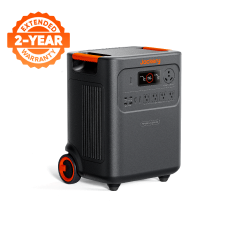
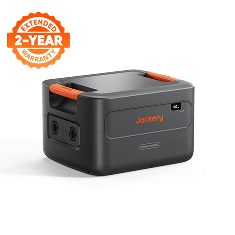
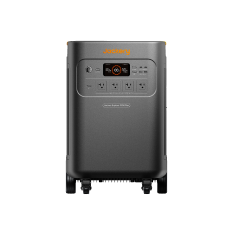
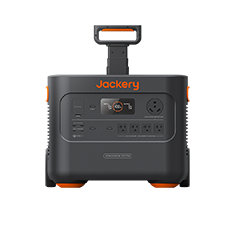
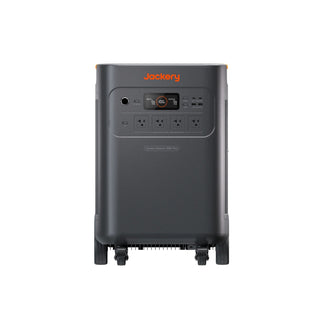
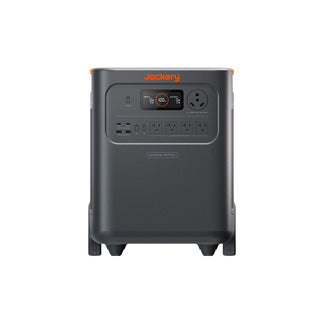
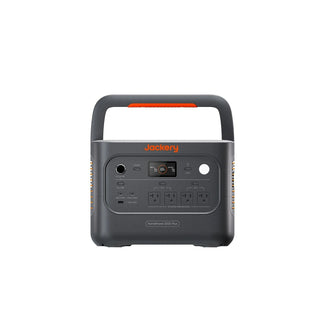
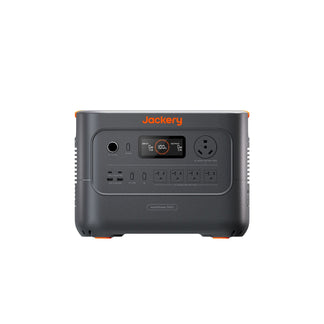
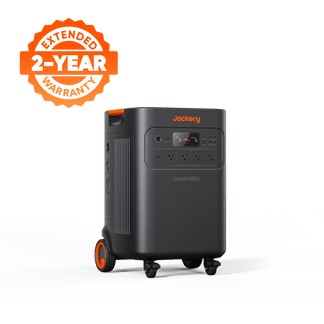
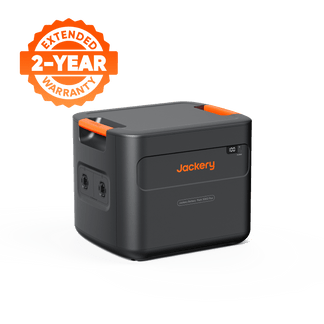
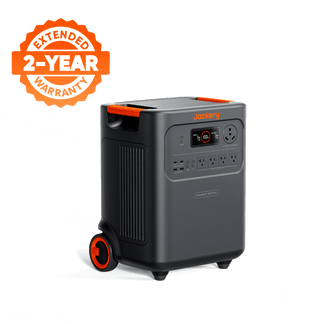
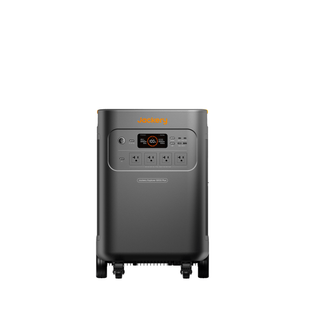
Knowing your home’s wattage profile lets you pick the right backup system. The table below matches Jackery solutions to different essential‑load scenarios, focusing on surge capacity and expandable storage.
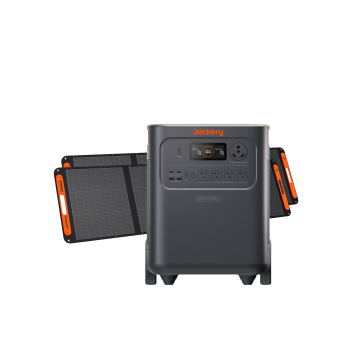
Model |
Continuous / Surge Power |
Core Capacity (Expandable) |
UPS Switchover |
Ideal Use Case |
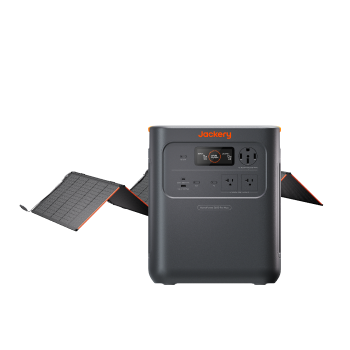
3,600 W / 7,200 W |
3,584 Wh (up to 21.48 kWh) |
<20 ms |
Refrigerator, freezer, lighting, home office; overnight essential circuits with solar recharging |
|
3,600 W / 7,200 W |
3,072 Wh |
<20 ms |
Well‑insulated home running essential appliance circuits; 10‑year battery service life |
|
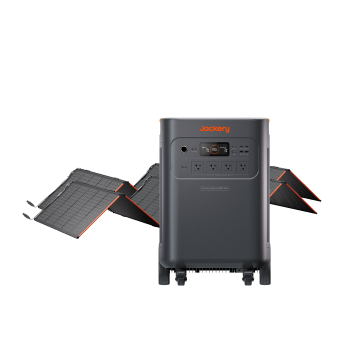
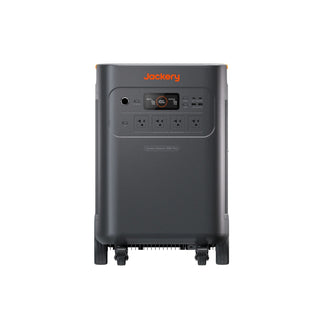
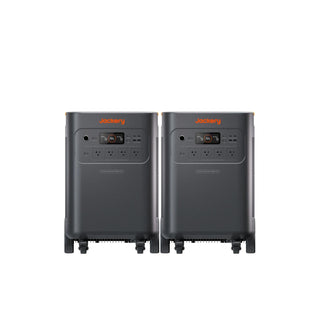
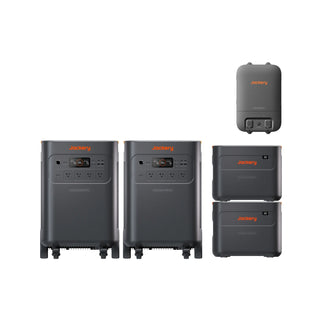
Jackery Solar Generator 5000 Plus |
7,200 W / 14,400 W |
5,040 Wh (up to 60 kWh) |
0 ms |
High‑surge homes with central AC startup spikes; extended multi‑day outage coverage |
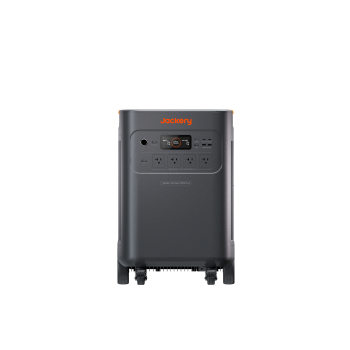
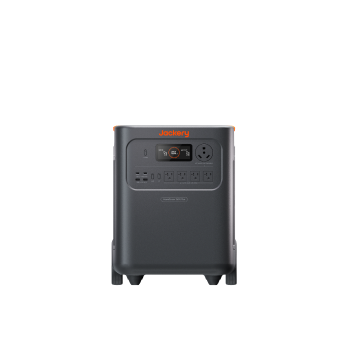
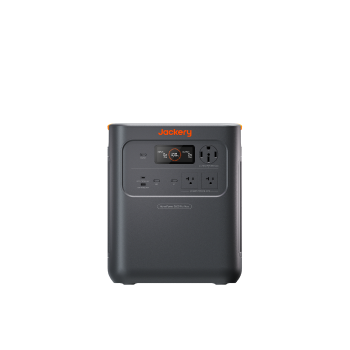
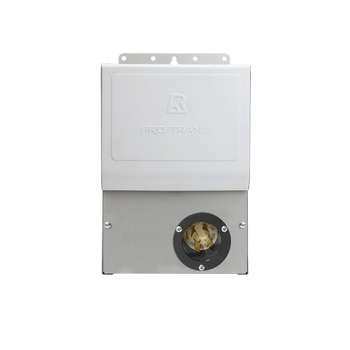
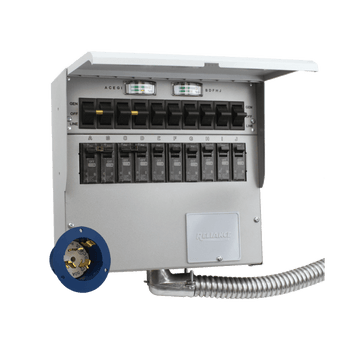
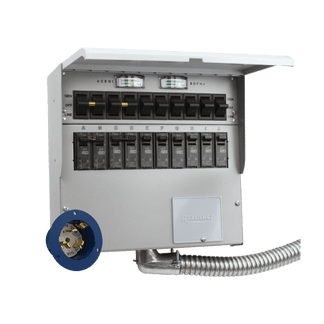
All systems require a transfer switch installed by a licensed electrician for permanent connection to essential circuits. The 5000 Plus handles typical 10,000 W peaks, while the 3600 Plus and 3000 cover the 5,000–7,000 W surge range of most well‑managed homes.
Frequently Asked Questions (FAQ)
Is 1000 kWh per month normal for a home?
Yes, the U.S. average is about 886 kWh per month, so 1,000 kWh is slightly above normal and common in homes with central AC or electric heating.
How much does a standby power draw cost per year?
Phantom loads from idle electronics and appliances typically cost $100–$200 annually, depending on your local electricity rate.
Can I read my wattage from the main breaker panel safely?
Only if you use a clamp‑on meter around the main feed wires; never open the panel cover without proper training and safety gear.
What appliance uses the most standby power?
Old cable or satellite DVR boxes with hard drives can draw 30–50 W continuously, adding more to your baseline than many other devices.
How long does a typical motor startup surge last?
Most motor surges last 1–3 seconds, though some well pumps and AC compressors can hold inrush current for up to 5 seconds.
Sources & References
[1] U.S. Energy Information Administration, “Residential Energy Consumption Survey (RECS),” https://www.eia.gov/consumption/residential/, accessed June 2026.


