





![[Add-on] Jackery SolarSaga 500 X - Jackery](http://www.jackery.com/cdn/shop/files/add-on-jackery-solarsaga-500-x-1493607.webp?v=1786503068&width=324)
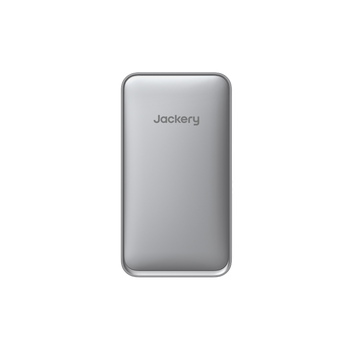
![[Add-on] Jackery Battery Pack 5000 Plus - Jackery](http://www.jackery.com/cdn/shop/files/add-on-jackery-battery-pack-5000-plus-6713401.webp?v=1786503068&width=324)







Quick Answer: Weather dramatically affects sunlight panel output. Panels operate most efficiently at 25°C (77°F), but cell temperatures can climb to 65°C, causing voltage loss. A -0.35%/°C coefficient drops a 1000W system by 35W per 10°C rise above 25°C. Thin clouds allow 70–80% output, while thick storm clouds reduce it to 10–25%. Cold weather boosts voltage, and rain provides natural cleaning that improves long-term efficiency.
Key Takeaways:
- Solar panels lose 0.3%–0.5% efficiency per degree Celsius above 77°F, meaning a 400W panel may produce only ~344W on a 95°F day when cell temperature reaches 149°F. [1]
- Cloudy weather still generates power — thin clouds allow 70%–80% of normal output, while thick storm clouds drop production to 10%–25%. [2]
- Rain reduces immediate output by 4%–9% but cleans dust and debris, improving overall panel efficiency over time.
- Snow accumulation can cause up to 4.5% annual energy loss in North America, though dark panel surfaces and steep tilt angles help shedding.
- Total daily energy (Wh) matters more than peak power spikes — full sunny days harvest more total energy despite the “cloud edge effect” creating higher instantaneous peaks.
How Temperature Affects Sunlight Panel Output
Heat reduces voltage far faster than it increases current, cutting power output by 10–25% during heatwaves. For a -0.35%/°C coefficient, a 1000-watt system loses 35W for every 10°C rise above the standard 25°C (77°F) lab rating.
The net result is a 10–25% power drop during heatwaves. On a 110°F day, cell temperatures often reach 149°F — roughly 65°C — triggering a real 10–20% output loss. That can surprise anyone expecting peak summer numbers.
Cold weather boosts performance because lower cell temperatures cut internal resistance, raising voltage and efficiency. Panels have a safe operating range from -40°F to +185°F, so while summer heat temporarily suppresses output, it causes no permanent damage.
Here’s how a typical 400W module reacts to rising ambient temperature:
Ambient Temperature |
Cell Temperature (approx.) |
Power Output (400W rated) |
Loss from STC |
77°F (25°C) |
77°F (25°C) |
400W |
0% |
86°F (30°C) |
113°F (45°C) |
372W |
7% |
95°F (35°C) |
149°F (65°C) |
344W |
14% |
104°F (40°C) |
176°F (80°C) |
324W |
19% |
Assumes -0.35%/°C temperature coefficient. First row shows STC (25°C cell temperature). Subsequent rows assume typical cell temperature rise under full sun.
How Cloud Cover and Rain Impact Charging
Thin clouds allow 70–80% of normal output, while thick storm clouds drop production to 10–25%. Thin overcast allows 70–80% of normal output because diffuse sunlight still reaches the panel’s surface. Thick storm clouds, however, cut production to 10–25% of rated capacity. [2]
The “edge-of-cloud” effect can briefly push output above the panel’s nominal rating when sunlight reflects off cloud edges right before clearing. But those spikes are short — total daily energy remains far lower on overcast days.
Rain during a downpour reduces immediate efficiency by 4–9%, but the true value shows up later. Dust, pollen, and bird droppings can cost you 5–15% in lost efficiency over weeks. Rain naturally washes panels clean, restoring that missing performance without any effort.
Seasonal cloud patterns matter enormously. The Pacific Northwest averages around 40% less annual solar production than the Southwest simply because of persistent cloud cover. You can’t change the weather, but you can size your system accordingly.
Output under different sky conditions (relative to clear-sky rating):
Sky Condition |
Typical Output |
Clear, direct sun |
100% |
Hazy, light clouds |
80–90% |
Thin overcast |
70–80% |
Thick storm clouds |
10–25% |
Heavy rain |
5–10% |
Complete darkness |
0% |
Snow, Shade, and Other Environmental Factors
Snow accumulation can cause up to 4.5% annual energy loss in North America, and heavy accumulation blocks all sunlight until it slides off. Light snow reduces output roughly in proportion to the covered area, while heavy accumulation blocks all sunlight until it slides off. North American homeowners lose an estimated 4.5% of annual energy to snow coverage.
Steep tilt angles above 30° help snow shed naturally. Dark panel surfaces warm slightly in even weak sunlight, speeding the melt. Bifacial panels — which capture light on both sides — lose only about 2% of annual output from snow, compared to roughly 16% for monofacial designs left unmaintained.
Partial shade is a silent efficiency killer. A single shaded cell in a string can drop the whole string’s output by 50–80% if bypass diodes aren’t isolating the problem. Modern panels include passive bypass diodes, but even a small obstruction — a chimney shadow, an overgrown branch — can surprise you with a disproportionate drop.
Dust and pollen accumulate 5–15% efficiency loss in dry regions, and rain provides the primary natural cleaning mechanism. Altitude helps: panels at 5,000 feet operate 5°C–10°C cooler than those at sea level, boosting efficiency by 2–4% purely from the thinner, cooler air.
How to Optimize Charging in Variable Weather
Oversize your solar panel capacity by 20–30%. On cloudy days or in winter, that buffer compensates for reduced irradiance and keeps daily energy harvest acceptable. If your battery needs 2000Wh daily and you average 4 peak sun hours, spec panels for 600W or more instead of the theoretical 500W — the extra 20–30% covers weather losses.
Reposition portable panels throughout the day. Face a panel directly at the sun and adjust its tilt every 2–3 hours. This simple habit can increase total daily watt-hours by 15–25% compared to a fixed flat orientation, especially in winter when the sun rides low.
Store excess in a battery. A sunny morning often produces far more energy than you need in real time. A battery lets you shift that surplus to evening peaks or consecutive overcast days. Together with a home backup power solution, you’re less dependent on minute-by-minute sunshine.
Monitor real-time production. Most portable solar generators include apps that track current wattage, daily total, and estimated normal output. A sudden drop that doesn’t match the forecast often signals a shading, dirt, or connection issue you can fix immediately.
Use high-efficiency panels. Panels with 22–24% cell efficiency convert more of the available light into electricity per square foot. In low-light conditions — early morning, thin clouds, winter sun — that 4–6% efficiency advantage over standard 18–20% panels translates directly into usable watt-hours.
Limitations / What to Know Before
Cloudy-day output is unpredictable. Actual production hinges on cloud thickness, altitude, and latitude — not just a weather report. A “partly cloudy” forecast can swing your harvest from 30% to 80%.
Heatwaves cause temporary drops. A 10°F rise above 77°F cuts output by 3–5%. That compounds during summer afternoons when you most want cooling power. It’s a real decrease, not a sign of failure.
Snow does not always slide off on its own. Low-angle roofs under 20° and light, fluffy snow can block panels for days unless you rake them. Bifacial modules help, but in the heaviest snow regions, plan for manual clearing.
Many beginners worry their system is broken when output plummets to 10–25% on overcast days. This is normal behavior — not a defect. Thick storm clouds can drop production to 5% or even 0%, so essential home backup battery capacity is critical for continuous power during extended outages.
Product Recommendation: Jackery Solar Generator for Weather-Resilient Power
When weather cuts solar output, the right gear keeps essentials running. Jackery’s portable power stations pair high-efficiency panels with robust batteries to capture every available watt-hour.
Weather Challenge |
Jackery Solution |
Key Specs & Benefit |
Overcast days, diffuse light |
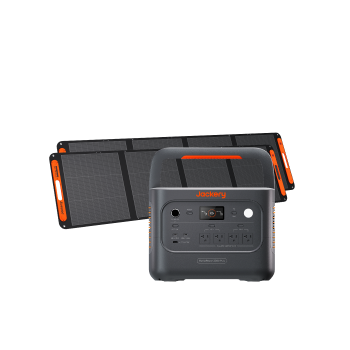
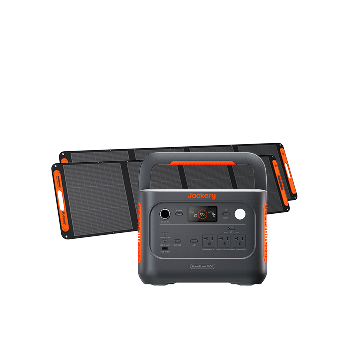
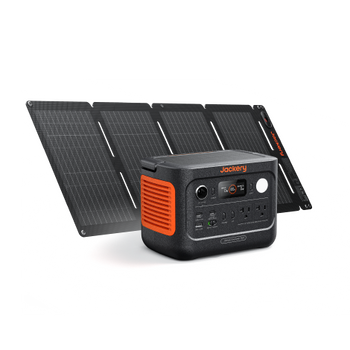
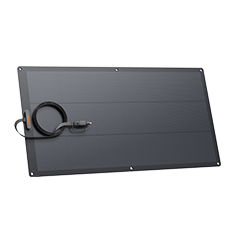
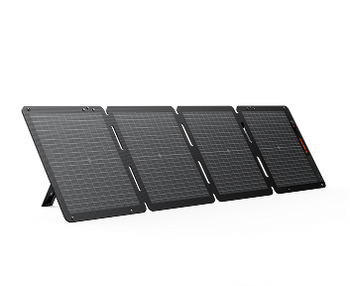
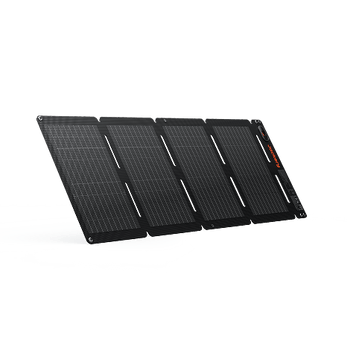
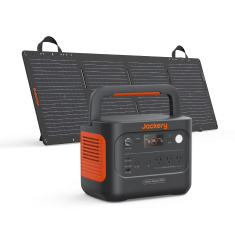
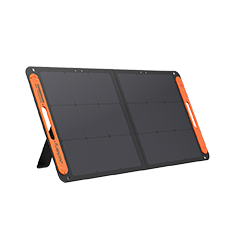
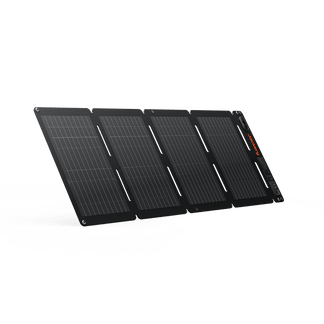
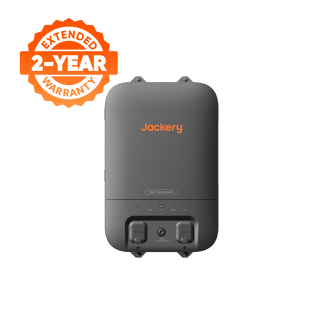
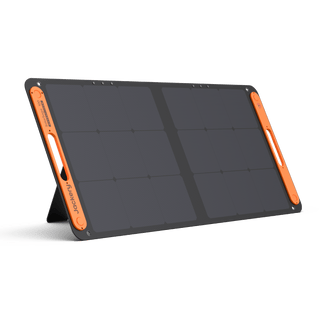
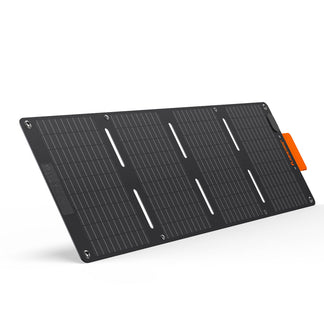
SolarSaga 500X |
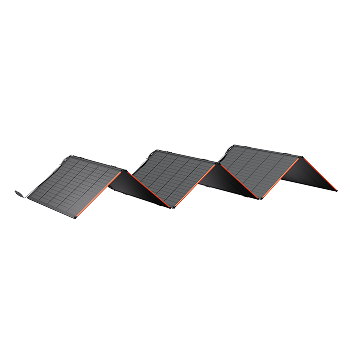
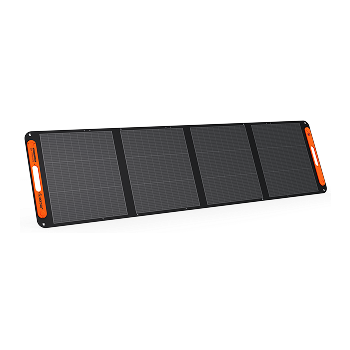
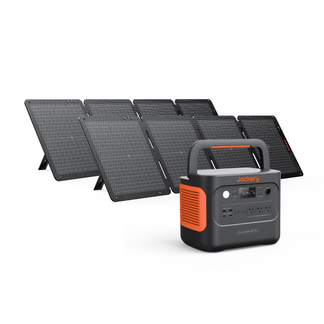
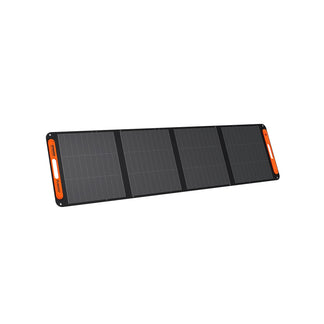
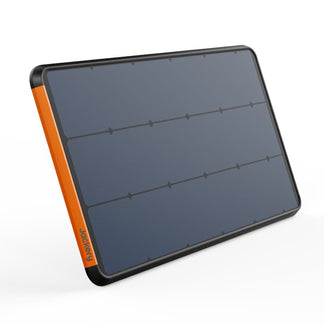
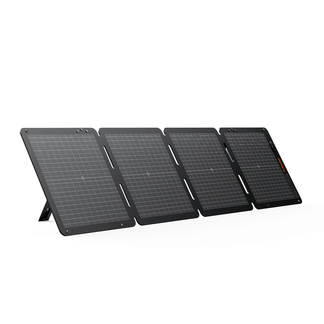
- Peak Power: 500W - Cell Efficiency: 25% TOPCon bifacial — captures more diffuse light - Durability: IP68 waterproof & dustproof for rain/snow/debris - Design: Foldable & portable for sun tracking |
Evening backup after cloudy charging |
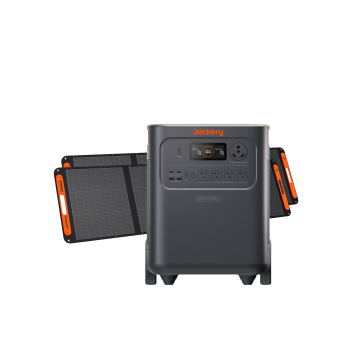
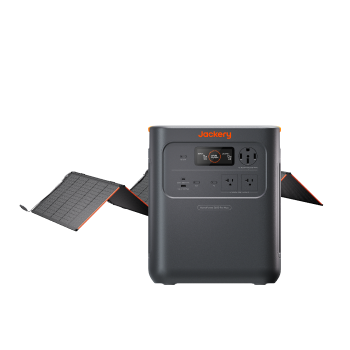
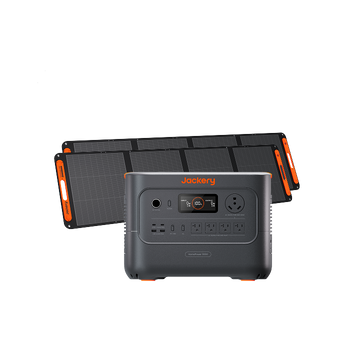
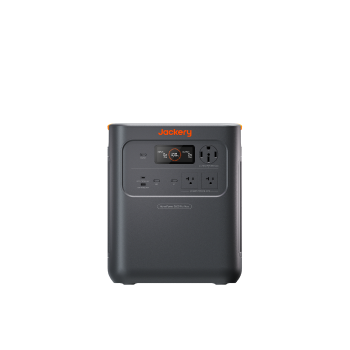
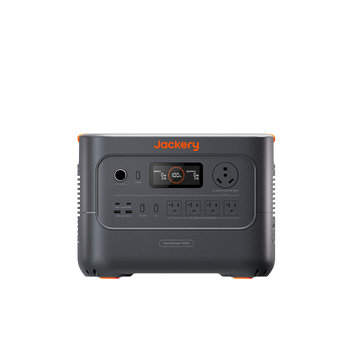
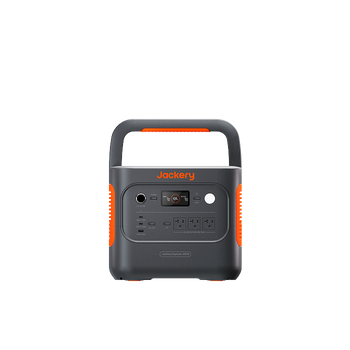
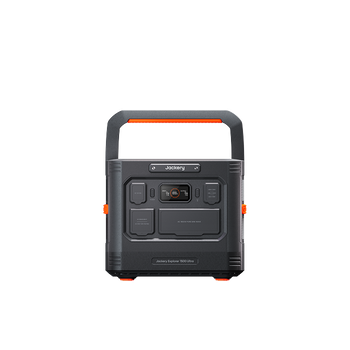
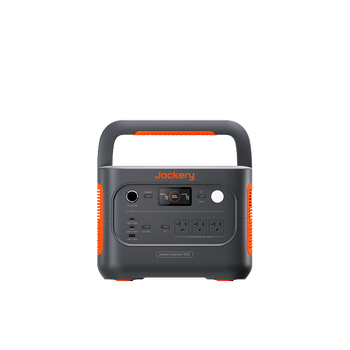
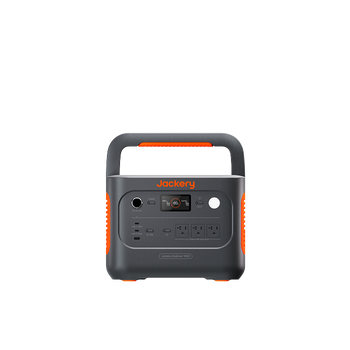
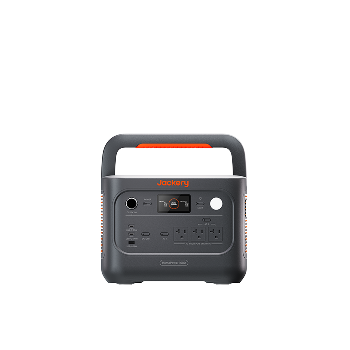
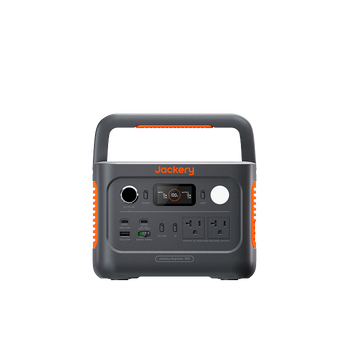
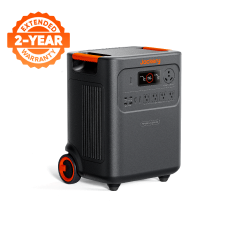
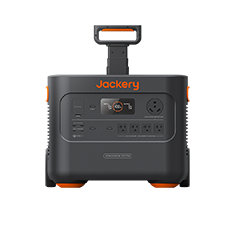
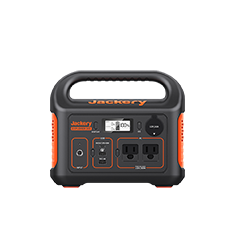
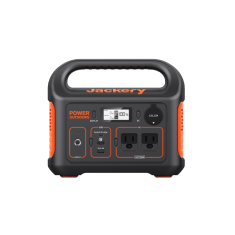
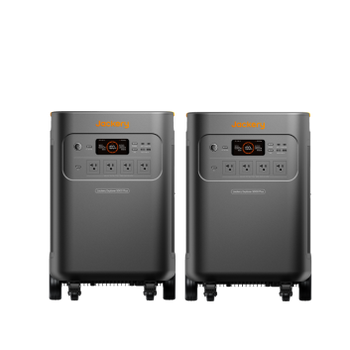
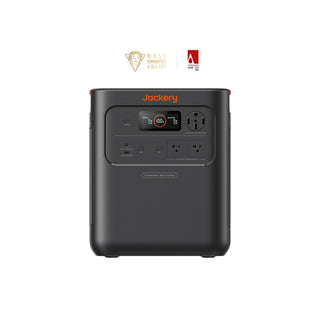
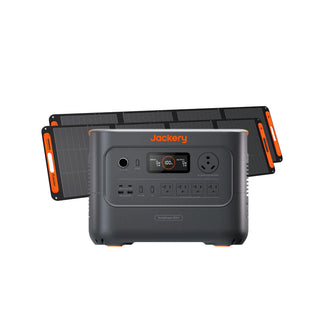
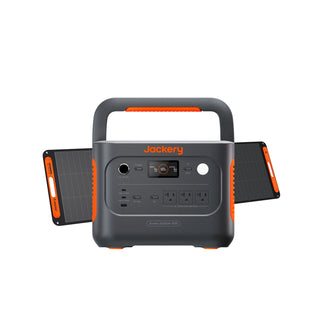
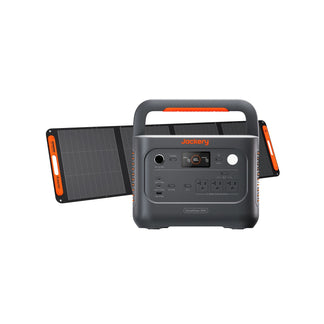
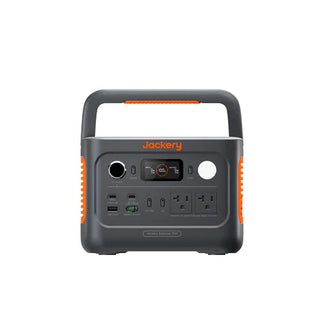
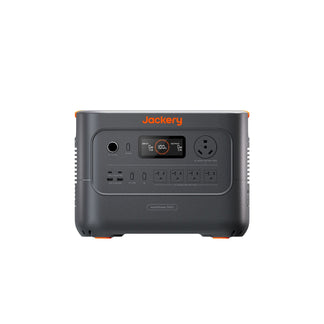
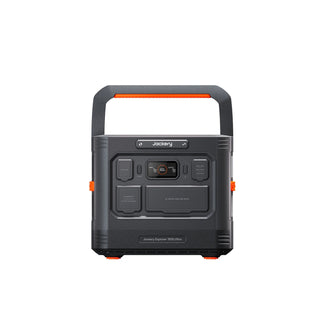
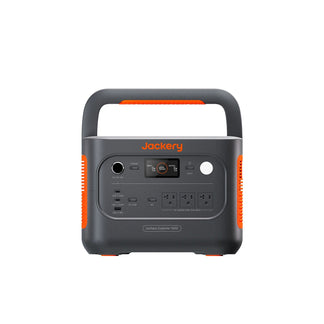
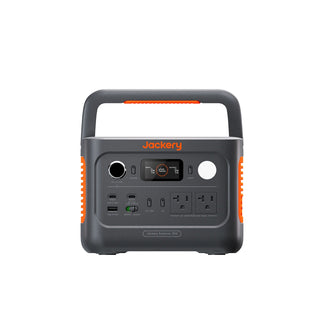
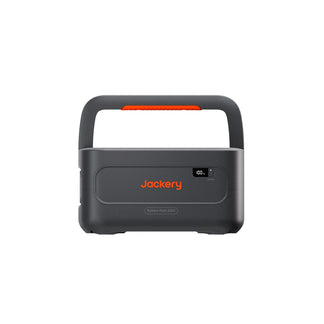
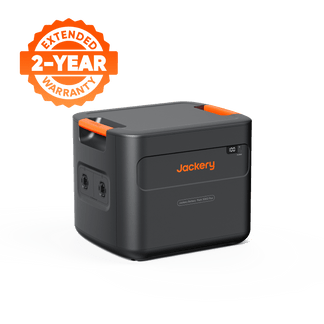
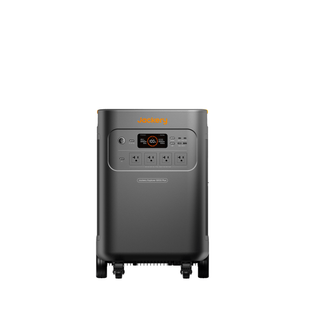
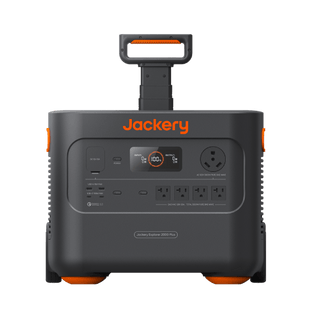
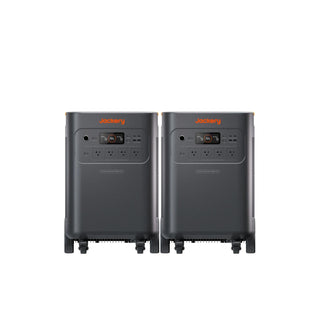
Jackery Explorer 2000 v2 Portable Power Station |
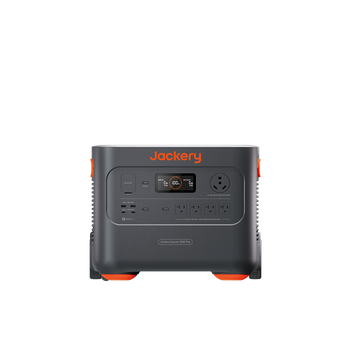
- Capacity: 2042Wh LiFePO4 - Output: 2200W — runs a refrigerator ~3.2 hours - Fast Recharge: 1.7-hour emergency super charge - Backup: UPS <20ms switchover for outage protection |
Extended cloudy stretches, multi‑day outages |
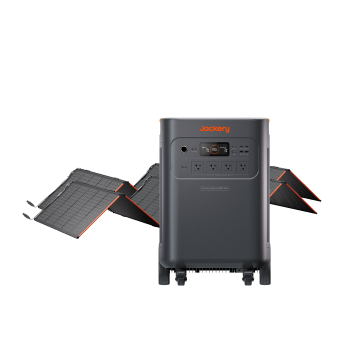
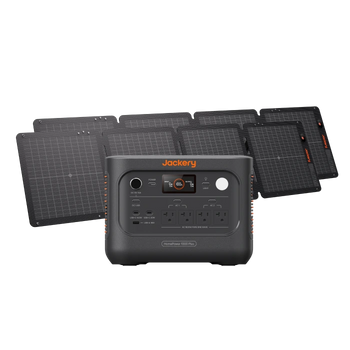
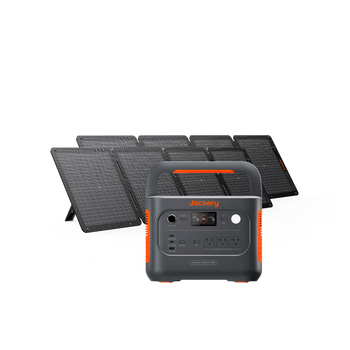
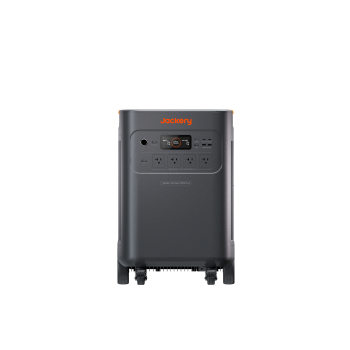
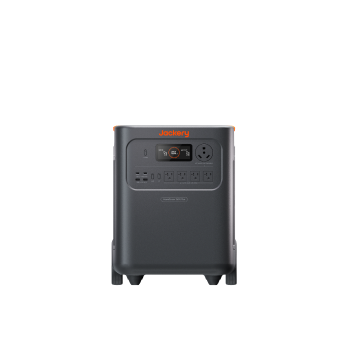
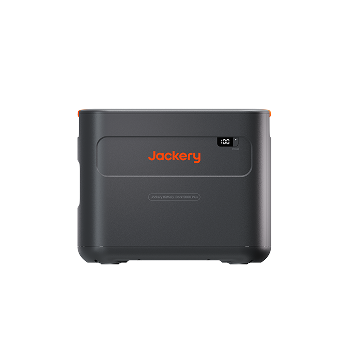
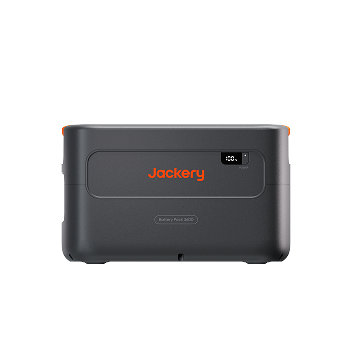
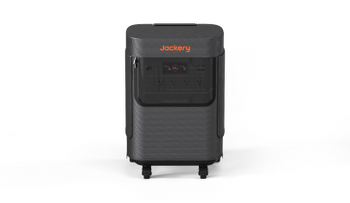
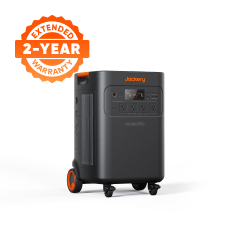
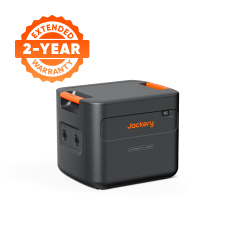
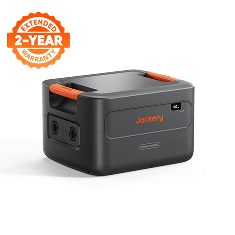
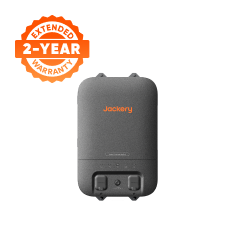
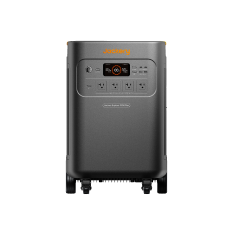
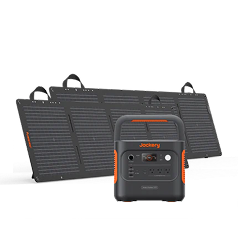
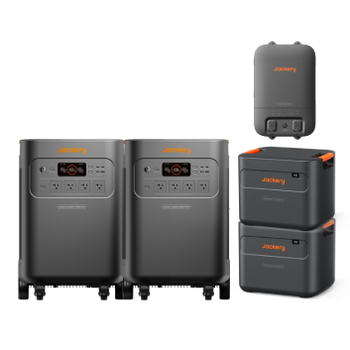
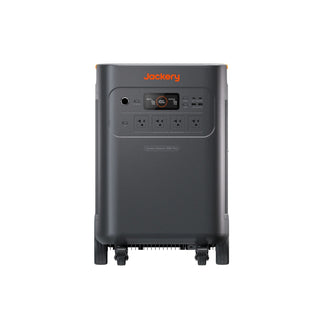
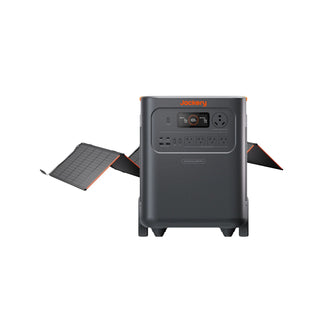
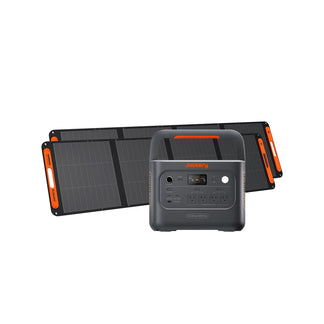
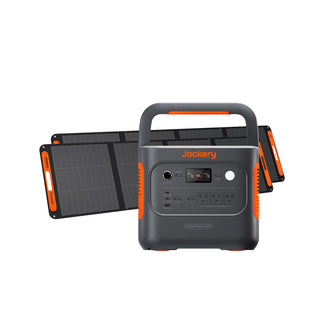
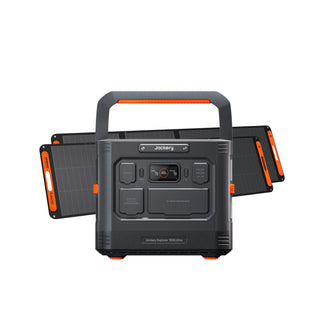
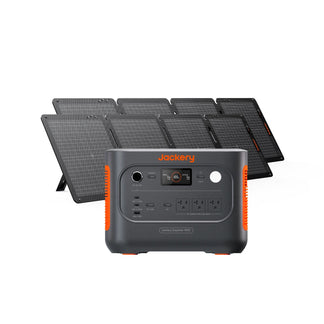
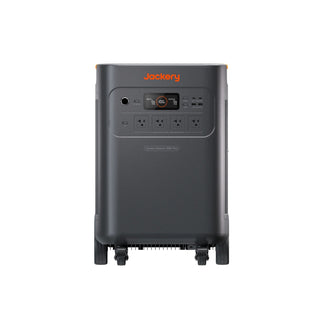
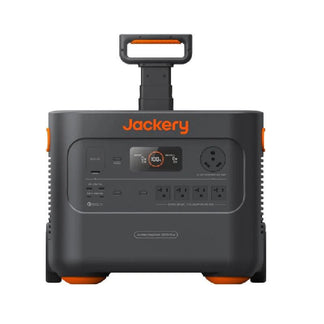
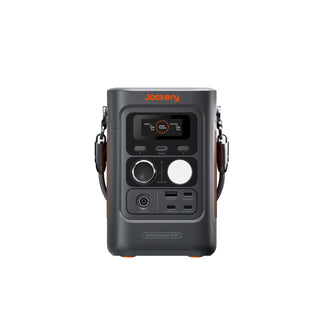
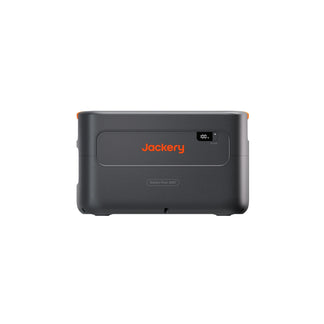
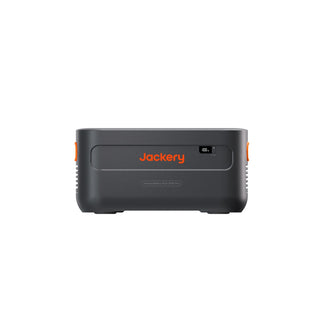
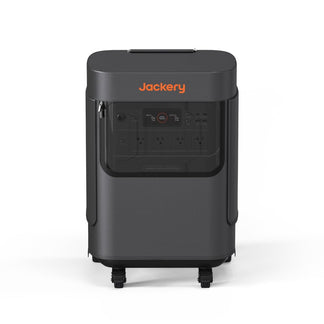
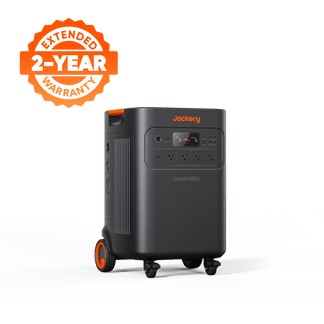
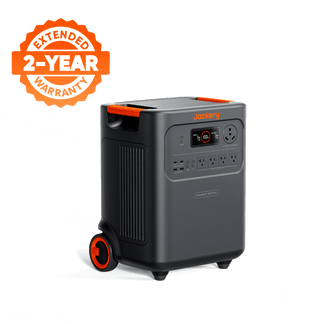
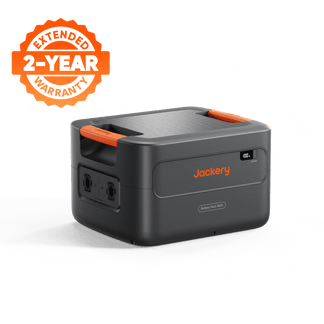
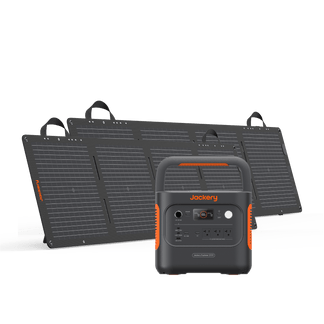
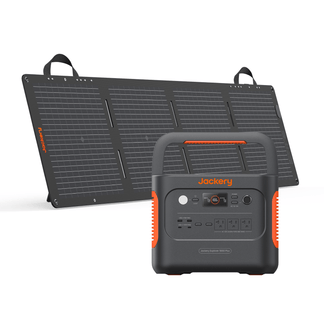
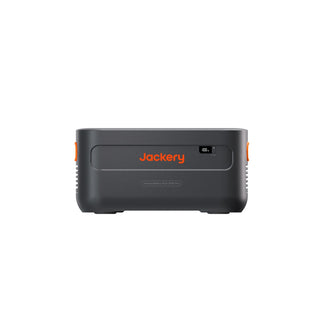
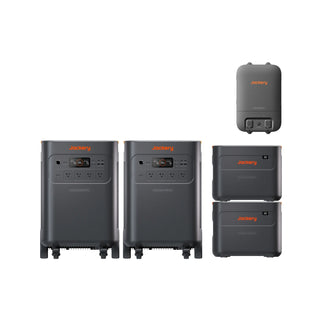
Solar Generator 5000 Plus + 2× SolarSaga 500X |
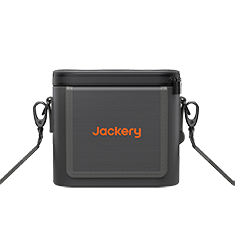
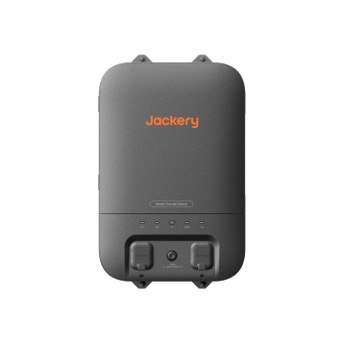
- Capacity: 5040Wh expandable - Output: 7200W — powers multiple essential loads - Solar Input: 2× SolarSaga 500X (1000W total), scalable to 4000W |
Learn what Jackery power stations can run for a detailed appliance-by-appliance breakdown. For outdoor work or off-grid scenarios, a scalable home backup system ensures you’re never caught short.
Frequently Asked Questions (FAQ)
How often should I clean my solar panels?
Most panels need cleaning every six to twelve months. Rain does the job in most climates; only in prolonged dry, dusty conditions should you rinse them manually.
How does humidity affect solar panel output?
High humidity scatters sunlight and reduces panel efficiency by 5–15%, similar to hazy skies. It’s a subtle but measurable drag on daily harvest.
Will my solar panels work during a power outage?
Standard grid-tied solar panels automatically shut down for safety. A battery system with islanding capability — such as a portable power station with UPS function — can isolate and provide backup power.
What is the typical lifespan of a solar panel?
Solar panels typically last 25 to 30 years, with gradual efficiency degradation of about 0.5% per year. [1]
What size solar system do I need for my home?
The average home needs a 5 to 10 kW system, but exact sizing depends on your energy usage, roof space, and local sunlight hours. A professional assessment or detailed energy audit gives the most accurate number.
Sources & References
[1] U.S. Department of Energy, “Solar Performance and Efficiency” — energy.gov (accessed June 25, 2026).
[2] U.S. Energy Information Administration, “Solar explained: Photovoltaics and electricity” — eia.gov (accessed June 25, 2026).


