There was a time when you didn’t have to go and compare electricity prices, providers, and others — it was just there. But now, every state has its own rates, providers, regulations, and challenges. Even after such intricate decision-making, bills continue to add up every year.
As many experts and the government recommend, investing in solar generators is the best way to get rid of increasing bills and save the environment simultaneously. Jackery Solar Generators are one of the best options to run refrigerators, air conditioners, and others and reduce your reliance on the utility grid.
Overview of US Electricity Prices
According to the U.S. Energy Information Administration, the average electric price in the US in 2024 is 15.45 cents per kWh [1], and it is expected to peak even further in the near future. This is because the US uses different technologies and energy sources to generate electricity, such as fossil fuels or natural gas, renewable energy sources, and nuclear energy, with natural gas as the primary source.
In 2023, natural gas was the source of around 40% of electricity, whose price exploded in the same year due to lower production, the impact of weather, and disruption overseas. You can expect things to get even worse. Let's understand the factors influencing electricity prices in detail:
- Fuels : Fuel prices, especially petroleum fuels and natural gas, may increase when there’s high electricity demand and/or disruption in fuel supply due to extreme weather conditions or accidental damages. Higher fuel prices thereby result in higher costs to generate electricity.
- Power Plant Costs : Each power plant requires maintenance, construction, finance, and operating costs, which add up to the rates.
- Transmission System : The system disbursing electricity to consumers also involves costs similar to power plants, with additional repair costs when subjected to accidents and/or extreme weather.
- Weather Conditions : Extreme hot or cold weather increases the electricity demand and fuel prices.
- Regulations : In certain US states, public utility commissions fully regulate fuel and electricity prices, while in other states, it’s a combination of regulated and unregulated prices.
Worsening climate conditions, an increasing population, and rising demand for electricity will raise electricity prices even higher. EIA forecasts the rate to be 16.20 cents per kWh [2] in 2025, around a 5% increase. However, it expects a potentially lowered dependence on natural gas.
Compare Electricity Prices & Rates by States
As of 2024, the average electricity rate in the US is 15.45 cents per kWh compared to 15.47 cents per kWh in 2023. That’s not much of a change from January 2022, when the price increased by around 12.76 % [3].
Aside from the ones as mentioned earlier, the price you pay for electricity (cents per kWh) depends on multiple factors, including where you stay and the type of building (commercial/residential). Commercial and industrial electricity rates are lower than residential, based on various factors like consumption patterns, infrastructure costs, demands, and regulatory aspects.
For example, industrial & commercial electricity rates in Connecticut as of January 2024 were 16.95 and 20.77 cents per kWh, compared to 27.32 cents per kWh in the residential sector.
The following tables compare electricity prices amongst various states in the US across residential, commercial, and industrial sectors:
Residential Electricity Prices by States
|
State |
Electricity Rates in 2024 (¢ per kWh) |
Electricity Rates in 2023 (¢ per kWh) |
Increase / Decrease (% Change) |
|
Alabama |
14.40 |
14.36 |
+0.27% |
|
Alaska |
23.78 |
21.68 |
+9.7% |
|
Arizona |
14.11 |
12.62 |
+11.8% |
|
Arkansas |
11.24 |
11.42 |
-1.6% |
|
California |
29.49 |
26.48 |
+11.37% |
|
Colorado |
14.26 |
14.20 |
+0.42% |
|
Connecticut |
27.40 |
30.27 |
-9.48% |
|
Delaware |
15.53 |
14.26 |
+8.91% |
|
Florida |
14.79 |
14.93 |
-0.93 |
|
Georgia |
12.34 |
12.87 |
-4.11% |
|
Hawaii |
44.28 |
44.96 |
-1.51% |
|
Idaho |
10.79 |
10.58 |
+1.98% |
|
Illinois |
14.93 |
16.07 |
-7.09% |
|
Indiana |
13.75 |
15.43 |
-10.88% |
|
Iowa |
11.85 |
11.30 |
+4.86% |
|
Kansas |
13.04 |
12.97 |
+0.53 |
|
Kentucky |
12.27 |
12.68 |
-3.23% |
|
Louisiana |
10.82 |
11.94 |
-9.38% |
|
Maine |
25.89 |
24.10 |
+7.42% |
|
Maryland |
17.48 |
15.97 |
+9.45% |
|
Massachusetts |
28.34 |
31.83 |
-10.96% |
|
Michigan |
18.34 |
17.99 |
+1.94% |
|
Minnesota |
14.04 |
13.08 |
+7.33% |
|
Mississippi |
12.72 |
13.18 |
-3.49% |
|
Missouri |
10.82 |
10.73 |
+0.83% |
|
Montana |
11.98 |
10.73 |
+11.64% |
|
Nebraska |
9.85 |
9.35 |
+5.34% |
|
Nevada |
16.38 |
16.81 |
-2.55% |
|
New Hampshire |
25.07 |
31.74 |
-21.01% |
|
New Jersey |
17.90 |
16.91 |
+5.85% |
|
New Mexico |
13.76 |
13.53 |
+1.69% |
|
New York |
23.44 |
23.60 |
-0.67% |
|
North Carolina |
13.07 |
12.67 |
+3.15% |
|
North Dakota |
9.88 |
9.91 |
-0.30% |
|
Ohio |
15.58 |
14.32 |
+8.79% |
|
Oklahoma |
11.16 |
10.96 |
+1.82% |
|
Oregon |
13.84 |
12.04 |
+14.95% |
|
Pennsylvania |
17.39 |
18.01 |
-3.44% |
|
Rhode Island |
31.22 |
28.96 |
+7.80% |
|
South Carolina |
13.54 |
13.99 |
-3.21% |
|
Tennessee |
12.05 |
12.11 |
-0.49% |
|
Texas |
14.25 |
14.19 |
+0.42% |
|
Utah |
10.85 |
10.65 |
+1.87% |
|
Vermont |
20.98 |
19.95 |
+5.16% |
|
Virginia |
13.50 |
14.03 |
-3.77% |
|
Washington |
11.09 |
10.48 |
+5.82% |
|
West Virginia |
13.64 |
13.09 |
+4.20% |
|
Wisconsin |
16.46 |
16.05 |
+2.55% |
|
Wyoming |
10.86 |
10.28 |
+5.64% |
Source : EIA [4]
|
Top 10 Highest Electricity Prices (in ¢ per kWh) |
Top 10 Lowest Electricity Prices (in ¢ per kWh) |
|
1. Hawaii : 44.28 2. Rhode Island : 31.22 3. California : 29.49 4. Massachusetts : 28.34 5. Connecticut : 27.4 6. Maine : 25.89 7. New Hampshire : 25.07 8. Alaska : 23.78 9. New York : 23.44 10. Vermont : 20.98 |
1. Nebraska : 9.85 2. North Dakota : 9.88 3. Idaho : 10.79 4. Louisiana : 10.82 5. Missouri : 10.82 6. Utah : 10.85 7. Wyoming : 10.86 8. Washington : 11.09 9. Oklahoma : 11.16 10. Arkansas : 11.24 |
Source : EIA [5]
Commercial Electricity Prices by States
|
State |
Electricity Rates in 2024 (¢ per kWh) |
Electricity Rates in 2023 (¢ per kWh) |
Increase / Decrease (% Change) |
|
Alabama |
13.66 |
13.30 |
+2.70% |
|
Alaska |
21.31 |
20.09 |
+6.07% |
|
Arizona |
11.46 |
10.48 |
+9.35% |
|
Arkansas |
10.26 |
10.03 |
+2.29% |
|
California |
22.93 |
21.97 |
+4.37% |
|
Colorado |
10.84 |
11.05 |
-1.90% |
|
Connecticut |
20.56 |
21.40 |
-3.92% |
|
Delaware |
11.88 |
12.09 |
-1.74% |
|
Florida |
11.83 |
12.21 |
-3.11% |
|
Georgia |
11.96 |
11.60 |
+3.10% |
|
Hawaii |
42.20 |
43.65 |
-3.32% |
|
Idaho |
8.64 |
8.19 |
+5.49% |
|
Illinois |
11.36 |
11.87 |
-4.29% |
|
Indiana |
12.46 |
13.65 |
-8.71% |
|
Iowa |
9.73 |
9.31 |
+4.51% |
|
Kansas |
10.50 |
11.21 |
-6.33% |
|
Kentucky |
11.59 |
12.24 |
-5.31% |
|
Louisiana |
9.48 |
11.51 |
-17.63% |
|
Maine |
19.34 |
16.01 |
+20.79% |
|
Maryland |
13.07 |
14.62 |
-10.60% |
|
Massachusetts |
21.32 |
21.12 |
+0.94% |
|
Michigan |
13.70 |
13.25 |
+3.39% |
|
Minnesota |
11.51 |
11.22 |
+2.58% |
|
Mississippi |
11.13 |
13.04 |
-14.64% |
|
Missouri |
8.82 |
8.77 |
+0.57% |
|
Montana |
11.62 |
10.33 |
+12.48 |
|
Nebraska |
8.94 |
8.49 |
+5.30% |
|
Nevada |
11.15 |
11.75 |
-5.10% |
|
New Hampshire |
20.30 |
22.28 |
-8.88% |
|
New Jersey |
13.23 |
13.69 |
-3.36% |
|
New Mexico |
10.54 |
10.54 |
0 |
|
New York |
18.07 |
18.03 |
+0.22% |
|
North Carolina |
10.27 |
9.97 |
+3.01% |
|
North Dakota |
7.80 |
8.59 |
-9.19% |
|
Ohio |
10.51 |
10.50 |
+0.09% |
|
Oklahoma |
9.53 |
9.06 |
+5.19% |
|
Oregon |
11.20 |
10.20 |
+9.80% |
|
Pennsylvania |
10.84 |
12.02 |
-9.81% |
|
Rhode Island |
21.20 |
19.22 |
+10.30% |
|
South Carolina |
10.79 |
10.77 |
+0.18% |
|
Tennessee |
11.99 |
12.08 |
-0.74% |
|
Texas |
9.02 |
8.98 |
+0.44% |
|
Utah |
8.04 |
7.96 |
+1.005% |
|
Vermont |
18.35 |
17.34 |
+5.82% |
|
Virginia |
9.62 |
10.32 |
-6.78% |
|
Washington |
10.52 |
10.12 |
+3.95% |
|
West Virginia |
10.74 |
10.74 |
0 |
|
Wisconsin |
12.39 |
12.05 |
+2.82 |
|
Wyoming |
9.52 |
8.83 |
+7.81 |
Source : EIA [6]
|
Top 10 Highest Electricity Prices (in ¢ per kWh) |
Top 10 Lowest Electricity Prices (in ¢ per kWh) |
|
1. Hawaii : 42.2 2. California : 22.93 3. Massachusetts : 21.32 4. Alaska : 21.31 5. Rhode Island : 21.20 6. Connecticut : 20.56 7. New Hampshire : 20.3 8. Maine : 19.34 9. Vermont : 18.35 10. New York : 18.07 |
1. North Dakota : 7.80 2. Utah : 8.04 3. Idaho : 8.64 4. Missouri : 8.82 5. Nebraska : 8.94 6. Texas : 9.02 7. Louisiana : 9.48 8. Wyoming : 9.52 9. Oklahoma : 9.53 10. Virginia : 9.62 |
Source : EIA [7]
Industrial Electricity Prices by States
|
State |
Electricity Rates in 2024 (¢ per kWh) |
Electricity Rates in 2023 (¢ per kWh) |
Increase / Decrease (% Change) |
|
Alabama |
7.14 |
6.83 |
+4.53% |
|
Alaska |
19.13 |
17.65 |
+8.38% |
|
Arizona |
7.68 |
8.49 |
-9.54% |
|
Arkansas |
7.08 |
6.94 |
+2.01% |
|
California |
17.95 |
16.75 |
+7.16% |
|
Colorado |
8.28 |
8.64 |
-4.17% |
|
Connecticut |
16.53 |
16.50 |
0.18% |
|
Delaware |
8.54 |
9.19 |
-7.07% |
|
Florida |
9.16 |
10.33 |
-11.32% |
|
Georgia |
8.00 |
7.24 |
+10.49% |
|
Hawaii |
37.68 |
40.19 |
-6.24% |
|
Idaho |
6.78 |
6.04 |
+12.25% |
|
Illinois |
8.94 |
8.81 |
+1.47% |
|
Indiana |
8.20 |
9.25 |
-11.35% |
|
Iowa |
6.49 |
6.21 |
+4.51% |
|
Kansas |
8.10 |
9.03 |
-10.29% |
|
Kentucky |
7.14 |
7.31 |
-2.32% |
|
Louisiana |
5.75 |
7.18 |
-19.92% |
|
Maine |
15.26 |
12.07 |
+26.43% |
|
Maryland |
10.73 |
10.35 |
+3.67% |
|
Massachusetts |
18.53 |
18.62 |
-0.48% |
|
Michigan |
8.45 |
8.12 |
+4.06% |
|
Minnesota |
9.13 |
8.73 |
+4.58% |
|
Mississippi |
6.94 |
7.61 |
-8.80% |
|
Missouri |
7.42 |
7.46 |
-0.53% |
|
Montana |
12.57 |
10.46 |
+20.17% |
|
Nebraska |
7.53 |
7.22 |
+4.29% |
|
Nevada |
8.48 |
10.61 |
-20.07% |
|
New Hampshire |
17.23 |
17.04 |
+1.12% |
|
New Jersey |
11.54 |
12.25 |
-5.79% |
|
New Mexico |
5.47 |
5.90 |
-7.29% |
|
New York |
7.54 |
7.50 |
+0.53% |
|
North Carolina |
7.51 |
7.59 |
-1.05% |
|
North Dakota |
7.17 |
6.96 |
+3.02% |
|
Ohio |
7.25 |
7.56 |
-4.10% |
|
Oklahoma |
6.51 |
6.39 |
+1.88% |
|
Oregon |
7.61 |
7.57 |
+0..53% |
|
Pennsylvania |
8.05 |
8.47 |
-4.96% |
|
Rhode Island |
20.38 |
21.80 |
-6.51% |
|
South Carolina |
7.16 |
7.35 |
-2.59% |
|
Tennessee |
6.42 |
6.75 |
-4.89% |
|
Texas |
6.44 |
6.92 |
-6.94% |
|
Utah |
8.37 |
7.42 |
+12.80% |
|
Vermont |
11.53 |
12.06 |
-4.39% |
|
Virginia |
8.59 |
9.39 |
-8.52% |
|
Washington |
6.58 |
6.45 |
+2.02% |
|
West Virginia |
7.25 |
7.86 |
-7.76% |
|
Wisconsin |
8.50 |
8.18 |
+3.91% |
|
Wyoming |
6.97 |
6.82 |
+2.19% |
Source : EIA [8]
|
Top 10 Highest Electricity Prices (in ¢ per kWh) |
Top 10 Lowest Electricity Prices (¢ per kWh) |
|
1. Hawaii : 37.68 2. Rhode Island : 20.38 3. Alaska : 19.13 4. Massachusetts : 18.53 5. California : 17.95 6. New Hampshire : 17.23 7. Connecticut : 16.53 8. Maine : 15.26 9. Montana : 12.57 10. New Jersey : 11.54 |
1. New Mexico : 5.47 2. Louisiana : 5.75 3. Tennessee : 6.42 4. Texas : 6.44 5. Iowa : 6.49 6. Oklahoma : 6.51 7. Washington : 6.58 8. Idaho : 6.78 9. Mississippi : 6.94 10. Wyoming : 6.97 |
Source : EIA [9]
How to Find The Best Electricity Prices & Rates?
Electric rates vary greatly between states, from 9.85 ¢ per kWh in Nebraska to 44.28 ¢ per kWh in Hawaii. So, your electric bill is majorly influenced by where you live. The primary underlying reason is their differing fuel mixes: typically, the cheaper the power source, the more affordable your electricity is.
For example, the reason why residents of the Northeast pay more bills is their ever-increased reliance on natural gas, an expensive source. Meanwhile, electric bills in the South are mostly less due to their reliance on nuclear and coal power, which are comparatively cheaper.
Another reason might be deregulated markets. In certain states, consumers can choose their electric provider. This way, lawmakers attempt to eliminate monopoly providers and regulate energy rates, creating competition and lowering electric rates. For example, in Houston, CenterPoint Energy is the major provider, but people can choose from any available providers.
Pros of Deregulated Market
- You can choose your electricity provider.
- Competition can drive down costs.
- There are no monopolies.
- Competition can drive up the quality.
Cons of Deregulated Market
- Prices might not drop as expected.
- Administrative costs add up to the final bill.
- Private companies aren’t closely watched.
It might seem daunting, but with some homework, you can save a chunk of your expenses. Shopping for the best provider isn’t just about finding the lowest rate; it's also about paying close attention to terms of service, which PUCs disclose, such as delivery charges, base charges, early termination fees, and more. Make sure to consider all these factors during your research.
You can also monitor the real-time electricity rates from the following resources:
- Hourly Electric Grid Monitor, EIA [10]
- S. Bureau of Labor Statistics [11]
- International Energy Agency [12]
What Are The Electricity Providers In The US?
The US has an abundance of so-called best energy providers, some serving multiple states. The best among them are as:
- Constellation Energy Corporation : It is a public energy company that provides electric power, natural gas, and energy management services to people across the continental United States. Their average electricity rate is around 16.7 cents per kWh.
- Pacific Gas and Electric Corporation : PG&E is an investor-owned utility that provides natural gas and electricity to around 16 million customers in north and central California.
- Green Mountain Energy : It is a renewable energy company that uses renewable energy credits to sell electricity to its customers. They operate with a zero-carbon footprint and products with environmental benefits.
- Gexa Energy : Gexa Energy is a Houston-based electric provider that provides renewable energy plans to its commercial and residential customers in Texas.
All things said the best or most popular energy might not be the best for you. To start, compare electricity company prices and plans, where they get their power from, customer reviews, and company history. Also, it’s recommended not to just choose from the best, as there are others like Frontier Utilities, Direct Energy, Payless Power, Reliant Energy, TriEagle, Pulse Power, and other good ones in your area, so proper research is quintessential.
What Are The Electricity Plans in The US?
Depending on where you live, the providers, and other factors, you can sign up for various plans in a deregulated market, each with pros and cons. The typical plans the companies offer are fixed-rate, time-of-use, variable-rate, prepaid, and green energy plans.
To get the best plan and save the most, compare business electricity prices under each plan, deduce your consumption pattern, and the appliances you use. Yes, it’s that simple.
How to Save Money on Electricity in The US?
Here are a few tips as to how you can save money on electricity in the US:
- Replace your old energy-hogging appliances with Energy Star-rated ones.
- Install smart power strips on appliances to minimize energy consumption.
- If you’re on a TOU plan, try using heavy appliances in off-peak hours.
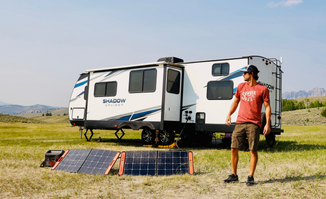
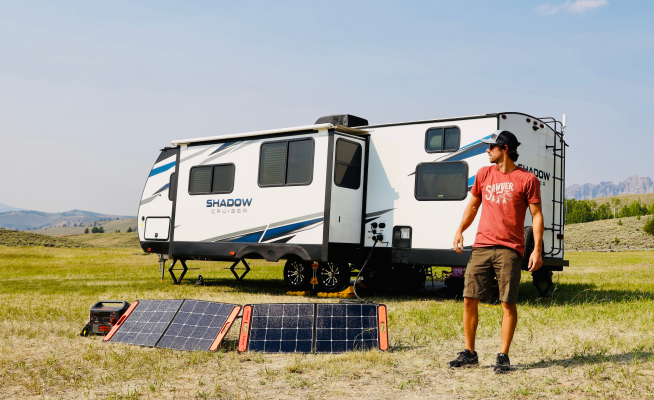
- Switch to solar energy to minimize reliance on electrical grids. It benefits not only financially but also environmentally. One of the best ways is to use Jackery Solar Generators that can charge and run up to 99% of home and outdoor appliances.
Jackery Solar Generators for Saving Your Electricity
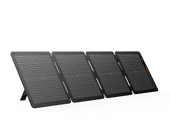
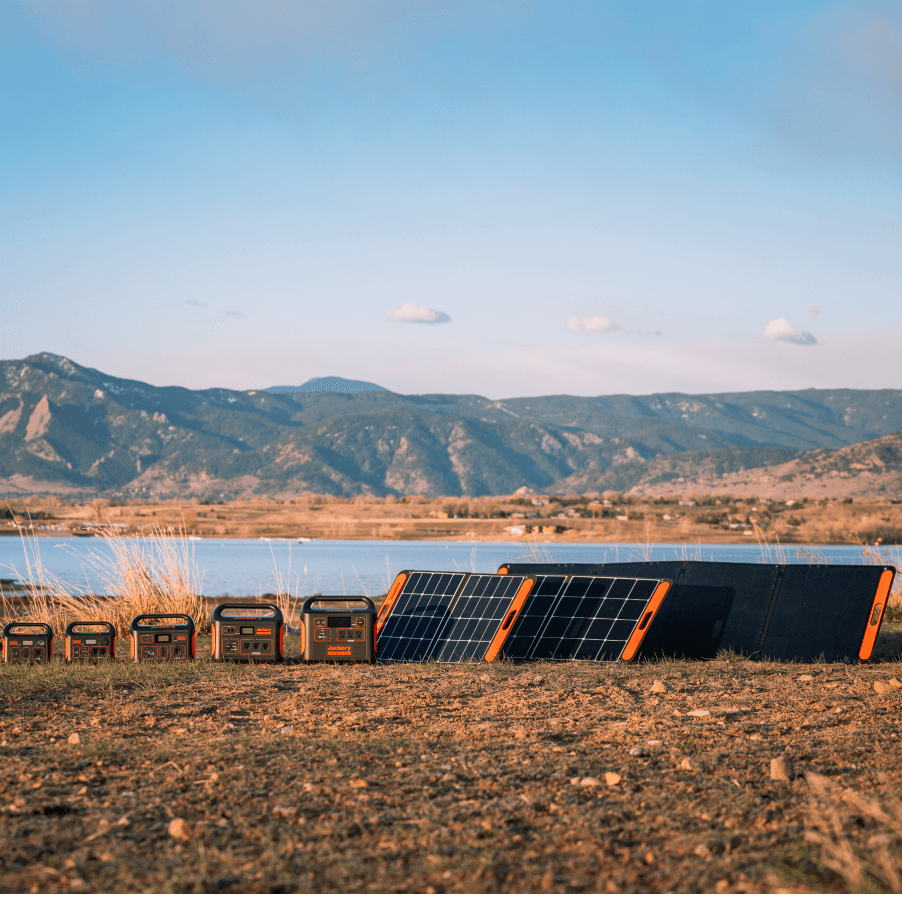
Jackery is a renowned brand that manufactures and sells solar generators, power stations, and solar panels. A portable Jackery Solar Generator combines foldable Jackery SolarSaga solar panels and Jackery Explorer Portable Power Stations to power up your appliances and cut down the bills.
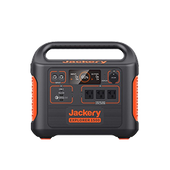
So how does it work? The monocrystalline silicon cells inside Jackery SolarSaga Solar Panels convert the sun’s rays into DC, which is further converted to AC current by the pure sine wave inverter of the Jackery Explorer Portable Power Station. It then passes on to power up the appliances. Here are some of the best battery backups for home from Jackery.
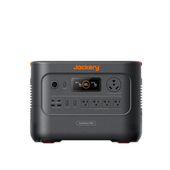
Jackery Solar Generator 3000 Pro
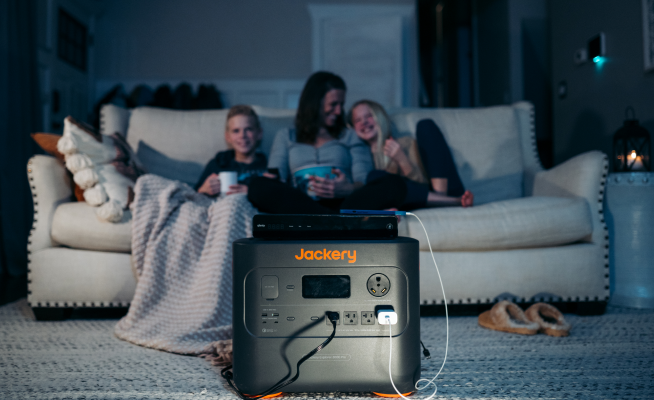
Jackery Solar Generator 3000 Pro, with its high-capacity NMC battery, is one of the popular options. Not only TV, light, and ceiling fans, it can also run your heavy equipment like air conditioners, space heaters, and up to 99% of your appliances. Besides, it’s chargeable with 6*Jackery SolarSaga 200W Solar Panels in 3.5 hours.

|
|
Solar Generator 3000 Pro |
|
Capacity |
3024 Wh |
|
Battery Cell |
NMC |
|
Cycle Life |
2000 cycles to 70%+ capacity |
|
Recharging Methods |
Solar Recharging : 3.5 H (6*Jackery SolarSaga 200W Solar Panels) Car Recharging : 35 H Wall Recharging : 2.4 H |
|
Output Ports |
AC Output (x1) : 120 V~ 60 Hz 25 A Max AC Output (x3) : 120 V~ 60 Hz 20 A Maximum USB-C Output (x2) : 100 W Maximum, 5 V⎓3 A, 9 V⎓3 A, 12 V⎓3 A, 15 V⎓3 A, 20 V⎓5 A |
|
Working Hours |
Dishwasher (1500 W) : 1.7 H TV (150 W) : 17.1 H Hair Dryer (1800 W) : 1.4 H AC (1000 W) : 2.6 H Microwave (1000 W) : 2.6 H |
|
Customer Review |
“Great service and great products. This is our 3rd Jackery. We've been fortunate to have solid backup power during storm outages in the last year.” — Gary Sult. |
Jackery Solar Generator 2000 Plus
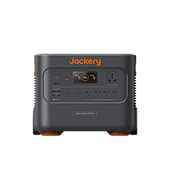
Jackery Solar Generator 2000 Plus is another great option for large households with plenty of appliances. The best part is you can pair an additional Jackery Battery Pack 2000 Plus to expand capacity from 2 kWh to 24 kWh and utilize it to power more appliances and save even more on electric bills.

|
|
Solar Generator 2000 Plus |
|
Capacity |
2-24 kWh |
|
Battery Cell |
LiFePO4 |
|
Cycle Life |
4000 cycles to 70%+ capacity |
|
Recharging Methods |
Solar Recharging : 2 H (6*Jackery SolarSaga 200W Solar Panels) Car Recharging : 25 H Wall Recharging : 2 H |
|
Output Ports |
AC Output (×4) : 120 V~ 60 Hz, 20 A Maximum AC Output (×1) : 120 V~ 60 Hz, 25 A Maximum USB-A Output (x2) : Quick Charge 3.0, 18 W Maximum USB-C Output (x2) : 100 W Maximum, (5 V, 9 V, 12 V, 15 V, 20 V up to 5 A) |
|
Working Hours |
Dishwasher (1500 W) : 1.2 H TV (150 W) : 11.6 H Hair Dryer (1800 W) : 1 H Water Heater (1125 W) : 1.5 H Microwave (1000 W) : 1.7 H |
|
Customer Review |
“The battery lasts a very long time. It's very easy to move around with the built-in tires. I love the upgradeability. It's the best solar generator I have ever had.”— Marc. |
Jackery Solar Generator 2000 Plus Kit (4kWh)
The Jackery Solar Generator 2000 Plus Kit (4kWh) encases a powerful battery to charge up to 96% of your household or off-grid appliances. The bundle components are different, as there are 1*Jackery Explorer 2000 Plus Portable Power Station, 1*Jackery Battery Pack 2000 Plus, and 2*Jackery SolarSaga 200W Solar Panels.

|
|
Solar Generator 2000 Plus Kit (4kWh) |
|
Capacity |
2-24 kWh |
|
Battery Cell |
LiFePO4 |
|
Cycle Life |
4000 cycles to 70%+ capacity |
|
Recharging Methods |
Solar Recharging : 2 H (6*Jackery SolarSaga 200W Solar Panels) Car Recharging : 25 H Wall Recharging : 2 H |
|
Output Ports |
AC Output (×4) : 120 V~ 60 Hz, 20 A Maximum AC Output (×1) : 120 V~ 60 Hz, 25 A Maximum USB-A Output (x2) : Quick Charge 3.0, 18 W Maximum USB-C Output (x2) : 100 W Maximum, (5 V, 9 V, 12 V, 15 V, 20 V up to 5 A) |
|
Working Hours |
Dishwasher (1500 W) : 2.4 H TV (150 W) : 23.1 H Hair Dryer (1800 W) : 1.9 H Water Heater (1125 W) : 3 H Microwave (1000 W) : 3.4 H |
|
Customer Review |
“I like the idea that if I need more power in the future I can purchase another battery pack. The wheels on the generator are great as 64 lbs is easier to pull/push instead of carrying it.” — Larry Gee. |
Compare Electricity Prices FAQs
What size of solar generator do I need for my apartment?
The size of the solar generator you need depends on your energy consumption pattern. For example, you use a TV (150 W) and an air conditioner (1000 W) simultaneously with Jackery Solar Generator 3000 Pro.
The number of hours these can run is calculated as :
Battery Capacity * 0.85 / Operating Wattage of Appliances = 3024 Wh * 0.85/1150 W = 2.2 H.
Who is currently the cheapest electricity provider?
Nebraska currently provides the cheapest electricity to its people.
Who has the cheapest electricity per kWh?
At 9.85 ¢ per kWh, Nebraska has the cheapest electricity per kWh.
What uses the most electricity in a home?
Heating and cooling appliances like heaters, air conditioners, and others use the most electricity in a home.
Final Thoughts
Electric rates in the US as a whole are constantly on the rise. However, numbers seem poles apart for certain states for various reasons. It’s thereby crucial that you compare electricity prices before you relocate to any.
Irrespective of the state you reside in, going solar with Jackery Solar Generators is always beneficial in the long run. With their high battery capacity, you can store the charge and use them in case of a power outage or when on the move.
References
[1] https://www.eia.gov/electricity/data/browser/#/topic/7
[2] https://www.eia.gov/outlooks/steo/report/elec_coal_renew.php
[3] https://www.eia.gov/electricity/data/browser/#/topic/7
[4], [5], [6], [7], [8], [9] https://www.eia.gov/electricity/monthly/epm_table_grapher.php?t=epmt_5_6_a
[10] https://www.eia.gov/electricity/gridmonitor/dashboard/electric_overview/US48/US48
[11] https://www.bls.gov/regions/midwest/data/averageenergyprices_selectedareas_table.htm
[12] https://www.iea.org/countries/united-states













![[Add - on] Jackery Manual Transfer Switch for Explorer 5000 Plus - Jackery](http://www.jackery.com/cdn/shop/files/add-on-jackery-manual-transfer-switch-for-explorer-5000-plus-9017324.png?v=1754016782&width=170)



















![Compare Electricity Prices & Rates for Every State [2024 Updated]](http://www.jackery.com/cdn/shop/articles/compare-electricity-prices-rates-for-every-state-2024-updated-6844656.jpg?v=1754018052)




Leave a comment