


![[Add - on] Jackery Manual Transfer Switch for Explorer 5000 Plus - Jackery](http://www.jackery.com/cdn/shop/files/add-on-jackery-manual-transfer-switch-for-explorer-5000-plus-9017324.png?v=1754016782&width=170)


Understanding batteries has never been easier, but the battery voltage charts can help you learn about the relationship between a battery's voltage and its charge state. These charts act as an important tool to understand how a battery's components work, so you can optimize the battery's performance and extend its lifespan. However, the battery voltage chart varies depending on the type of batteries you are using.
Jackery Portable Power Stations are ideal powering solutions for your household or outdoor appliances. They feature efficient and reliable batteries, such as NMC and LiFePO4. The upgraded BMS technology helps you safely power appliances without equipment damage due to voltage or circuit fluctuations. In this guide, we will reveal the battery voltage charts of different popular batteries, including lead-acid, deep cycle, LiFePO4, and AGM.
AI Takeaways
- Battery voltage is the clearest indicator of state of charge (SoC), but it must always be measured under the right conditions.
- Resting open-circuit voltage (OCV) after at least four hours without charge or load provides the most accurate SoC reading, while voltages under load or during charging can appear higher or lower than the actual state.
- LiFePO4 cells rest at around 3.4V (≈13.6V for a 12V pack), whereas lithium-ion (NMC/NCA) packs use higher charging voltages (up to 4.2V/cell) and deeper cutoff ranges.
- What is the state of charge and discharge chart.
- What are the different battery voltage charts for lead-acid deep cycle, lithium-ion, LiFePO4, and AGM batteries.
What Is Battery Voltage Chart
A battery voltage chart is a table or graph that shows the relationship between a battery's voltage level and its state of charge (SoC).
The term "battery voltage" represents the electrical potential difference between any battery's positive and negative terminals. The battery voltage is crucial because it determines the power or energy your battery can supply, its charge state, and the voltage required for certain electronics.
Battery voltage charts describe the relation between the battery's charge state and the voltage at which the battery runs. You can check or read a battery's voltage using a multimeter.
Here's a 12V battery chart that reveals the relationship between the charging state, voltage, and specific gravity hydrometer.
|
Percentage of Charge |
12V Battery Voltage |
Specific Gravity using Hydrometer |
|
100% |
12.70 |
1.265 |
|
95% |
12.64 |
1.257 |
|
90% |
12.58 |
1.249 |
|
85% |
12.52 |
1.241 |
|
80% |
12.46 |
1.233 |
|
75% |
12.40 |
1.225 |
|
70% |
12.36 |
1.218 |
|
65% |
12.28 |
1.204 |
|
55% |
12.24 |
1.197 |
|
50% |
12.20 |
1.190 |
|
45% |
12.16 |
1.183 |
|
40% |
12.12 |
1.176 |
|
35% |
12.08 |
1.169 |
|
30% |
12.04 |
1.162 |
|
25% |
12.00 |
1.155 |
|
20% |
11.98 |
1.148 |
|
15% |
11.96 |
1.141 |
|
10% |
11.94 |
1.134 |
|
5% |
11.92 |
1.127 |
|
0% (Discharged) |
11.90 |
1.120 |
Note: The resting OCV was measured after ≥ 4 hours with no charge/load and at ~25 °C. OCV falls with temperature and varies by manufacturer.
What are the Different Types of Batteries?
The battery voltage chart differs depending on the type of battery. Below we'll reveal five different types of batteries.
Lead-Acid: These battery types are economical and extremely popular choices. The heavy and bulkier batteries sometimes leak, making the device unusable.
Lithium-ion: These commonly used battery types have a superior energy density and can store more energy than others. These lightweight batteries are designed for portable devices.
Deep Cycle: A deep-cycle battery is designed to be regularly deeply discharged using its maximum capacity. It has thicker active plates, thicker separators, and higher-density active paste material.
LiFePO4: Also known as lithium iron phosphate or LFP battery, it offers increased power output, reduced weight, longer lifetime, and faster recharging.
AGM: AGM (Absorbent Glass Mat) is an advanced lead-acid battery type. The battery contains positive and negative lead and lead oxide plates that release electrons.
What Is State of Charge and Discharge Chart
A State of Charge (SoC) and Discharge chart, also known as a battery voltage chart, shows the relationship between a battery's voltage and its remaining energy level.
State of charge (SoC), usually represented in percentage, is the charge level of an electric battery relative to its capacity. Battery's SoC can be quickly determined by reading either specific electrolyte gravity or terminal voltage.
State of Charge and Discharge Chart
Lead-Acid Battery State of Charge (Resting OCV at 25 °C)
|
State of Charge (SOC) |
Flooded Lead-Acid |
AGM |
AGM battery voltage |
|
100% |
12.65 – 12.70V |
12.75 – 12.85V |
12.75-12.85V |
|
75% |
12.40V |
12.50V |
12.50V |
|
50% |
12.20V |
12.30V |
12.30V |
|
25% |
12.00V |
12.10V |
12.10V |
|
0% |
11.85 – 11.90V |
11.95-12.00V |
11.95-12.00V |
Notes:
- These voltages apply to rested batteries (no charging/discharging for ≥4 hours).
- AGM and Gel batteries typically read slightly higher OCV than flooded types.
- Actual values vary slightly by manufacturer, so kindly always check datasheets.
- Do not use hydrometer readings for AGM or Gel, since they are sealed.
A battery's depth of discharge (DoD) indicates the percentage of discharged battery relative to overall battery capacity. The depth of discharge (DoD) complements the state of charge (SoC). That means if DoD increases, SoC decreases.
Battery Voltage Charts
The battery voltage charts track the battery's voltage and maintain the battery. The primary role of voltage monitoring is to extend the battery's lifespan.
Lead-Acid Deep Cycle Battery Voltage Chart
Lead-acid battery voltage varies depending on the temperature, discharge rate, and battery type (sealed or flooded).
Flooded lead-acid batteries are cheaper but require proper ventilation and more maintenance. Alternatively, sealed lead-acid batteries need less maintenance and ventilation.
Lead-Acid Battery Voltage Chart
|
Capacity |
6V Sealed Lead Acid Battery |
6V Flooded Lead Acid Battery |
|
100% |
6.44V |
6.32V |
|
90% |
6.39V |
6.26V |
|
80% |
6.33V |
6.20V |
|
70% |
6.26V |
6.15V |
|
60% |
6.20V |
6.09V |
|
50% |
6.11V |
6.03V |
|
40% |
6.05V |
5.98V |
|
30% |
5.98V |
5.94V |
|
20% |
5.90V |
5.88V |
|
10% |
5.85V |
5.82V |
|
0% |
5.81V |
5.79V |
Lithium-ion Battery Voltage Chart
Lithium-ion batteries are most used in power stations and solar systems, all thanks to the built-in additional layer of security. The popular voltage sizes of lithium-ion batteries include 12V, 24V, and 48V. Let's understand the discharge rate of a 1-cell lithium battery at different voltages.
Lithium-ion Battery Voltage Chart:
Lithium-ion (NMC/NCA, 3.6V/3.7V nominal) Battery Voltage Chart – 11.1V (3S) Pack
|
State of Charge (SOC) |
Voltage per Cell (Rested) |
12V Pack (Rested, 3S) |
|
100% |
4.20V |
12.6V |
|
90% |
4.05V |
12.15V |
|
80% |
3.95V |
11.85V |
|
70% |
3.85V |
11.55V |
|
60% |
3.80V |
11.40V |
|
50% |
3.75V |
11.25V |
|
40% |
3.70V |
11.10V |
|
30% |
3.65V |
10.95V |
|
20% |
3.55V |
10.65V |
|
10% |
3.40V |
10.20V |
|
0% |
3.00V |
9.00V |
Note: 0% in the NMC table is 3.0 V/cell (typical operational cutoff). However, some packs allow lower absolute minimums, but always follow manufacturer/BMS cutoffs.
LiFePO4 Battery Voltage Chart
LiFePO4 battery voltage charts reveal the SoC (state of charge) based on different voltages, such as 12V, 24V, and 48V.
LiFePO4 Battery Voltage Chart:
Note: Resting open-circuit voltages are measured after ≥ 4 hours rest.
|
Percentage (SOC) |
1 Cell |
12V |
24V |
48V |
|
100% (rest after charge) |
3.40 |
13.60 |
27.20 |
54.4 |
|
100% (right after charge/charging) |
3.60 - 3.65 |
14.40 - 14.60 |
28.80 - 29.20 |
57.60 - 58.40 |
|
90% |
3.35 |
13.40 |
26.80 |
53.60 |
|
80% |
3.32 |
13.28 |
26.56 |
53.12 |
|
70% |
3.30 |
13.20 |
26.40 |
52.80 |
|
60% |
3.27 |
13.08 |
26.16 |
52.32 |
|
50% |
3.26 |
13.04 |
26.08 |
52.16 |
|
40% |
3.25 |
13.00 |
26.00 |
52.00 |
|
30% |
3.22 |
12.88 |
25.76 |
51.52 |
|
20% |
3.20 |
12.80 |
25.60 |
51.20 |
|
10% |
3.00 |
12.00 |
24.00 |
48.00 |
|
0% |
2.50 |
10.00 |
20.00 |
40.00 |
Deep Cycle Battery Voltage Chart
Deep cycle batteries are among the most used batteries that discharge slowly to a low SoC and recharge again. Here are the deep cycle battery charts for 12V, 24V, and 48V.
Deep Cycle Battery Voltage Chart:
|
Capacity |
12V |
24V |
48V |
|
100% |
100% (resting OCV, 25 °C): 12.65 - 12.85V 100% (during charge/absorption): ~13.0 - 14.4V (depends on stage & battery type — absorption commonly ~14.4 V, float ~13.5 V) |
25.30 - 25.70V |
50.60 - 51.40V |
|
99% |
12.80V |
25.60V |
51.20V |
|
90% |
12.75V |
25.50V |
51.00V |
|
80% |
12.50V |
25.00V |
50.00V |
|
70% |
12.30V |
24.60V |
49.20V |
|
60% |
12.15V |
24.30V |
48.60V |
|
50% |
12.05V |
24.10V |
48.20V |
|
40% |
11.95V |
23.90V |
47.80V |
|
30% |
11.81V |
23.62V |
47.24V |
|
20% |
11.66V |
23.32V |
46.64V |
|
10% |
11.51V |
23.02V |
46.04V |
|
0% |
10.50V (Please note that 10.50V is the extreme low) |
21.00V |
42.00V |
Note: Values are resting open-circuit voltages at 25 °C (77 °F), and actual numbers vary by manufacturer. These are resting OCVs - charging/absorption voltages (while on the charger) will be higher.
Deep Cycle AGM Voltage Chart
An AGM battery voltage chart describes the relationship between the state of charge, current, and voltage. Let's see how different charging or discharging currents affect battery voltages in this deep cycle AGM battery charge voltage chart.
12V AGM Deep Cycle Battery – Recommended Charging Voltages at 25 °C:
|
Charging Stage |
Voltage per Cell (2V) |
12V AGM Battery (6 Cells) |
|
Absorption (Bulk/Constant Voltage) |
2.40 V |
14.4 V |
|
Float (Standby Maintenance) |
2.25 V |
13.5 V |
|
Equalization (Not typically used on AGM) |
— |
Not recommended |
Notes:
- AGM batteries are sealed, so charging voltages must be carefully controlled to prevent gassing.
- Absorption voltage is used after bulk charging until the current tapers.
- Float keeps the battery fully charged for standby use.
- Temperature compensation is critical: reduce ~0.03 V per cell (~0.18 V for a 12V battery) for every 10 °C (50°F) above 25 °C (77°F).
Jackery Portable Power Stations Explained
Jackery is the leading manufacturer of portable power stations and solar solutions. These battery backups for homes or outdoors are designed to provide reliable power to various applications, including emergency power, camping, RVing, etc.
Jackery portable power stations use lithium-ion batteries, best known for their high efficiency and long lifespan. However, the Jackery Explorer 5000 Plus is equipped with a LiFePO4 battery. Some popular charging solutions offered by Jackery include:
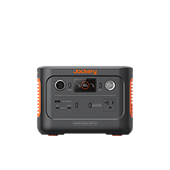
Jackery Explorer 300 Plus Portable Power Station
The Jackery Explorer 300 Plus Portable Power Station is a lightweight and compact charging solution that can run essential outdoor appliances, such as mobile phones, lights, laptops, TVs, and other devices. It has a foldable handle and weighs only 8.27 lbs, which makes the power station easier to move around during outdoor adventures such as hiking or camping.
Appliances Working Hours
- Mini Freezer (150W) = 1.5H
- TV (150W) = 1.5H
- Camera (50W) = 3.9H
- Portable Speaker (100W) = 2.1H
- Phone (30W) = 5.9H
Who Should Buy This
If you are someone who enjoys outdoor adventures such as hiking, camping, and fishing, you can consider investing in the Jackery Explorer 300 Plus Portable Power Station.

Customer Review
“I got the 300 to light small lights if the power goes off for an extended time. It is lightweight, and the handle makes it easy to carry around to various rooms as needed. My main thought is that if the grandkids are here, it will light their nightlight for several nights.” — Bob Wendlandt.
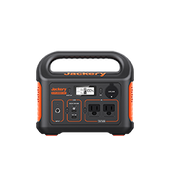
Jackery HomePower 3000
The Jackery HomePower 3000 is the advanced essential home backup solution that can power most household appliances during a power outage. You can run refrigerators, lights, fans, etc., in the kitchen, living room, or bedroom to live comfortably even when the grid is down. It is the lightest and smallest 3kWh LFP power station with dual-sided handles, so you can easily move it wherever the power is required.
Appliances Working Hours
- Refrigerator (300W) = 8.1H
- Microwave (1000W) = 2.6H
- Coffee Maker (800W) = 3.2H
- Washer Combo (2000W) = 1.3H
- Dishwasher (1500W) = 1.7H
Who Should Buy This
If you want to cut your monthly electricity bills or keep essential appliances powered during blackouts, this Jackery HomePower 3000 has got your back.
Customer Review
“Great home power system. We are using it as an all-in-one inverter/battery/solar system. For the price, it's unbeatable, high quality, and performance in each aspect!” — Bryan.
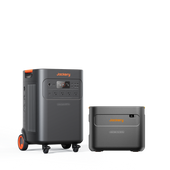
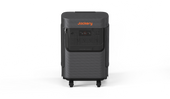
Jackery HomePower 3600 Plus
The Jackery HomePower 3600 Plus is the standard essential home backup solution that can keep your appliances running for days. It can be expanded up to 21kWh to provide reliable power to the fridge for up to 14 days. It is easy to transport from one place to another with the help of a telescopic handle and wheels. With the help of the Jackery Battery Pack HomePower 3600, you can expand the capacity and enjoy longer runtimes.
Appliances Working Hours
- Refrigerator (300W) = 9.5H
- Microwave (1000W) = 3.0H
- Coffee Maker (800W) = 3.7H
- Washer Combo (2000W) = 1.5H
- Dishwasher (1500W) = 2.0H
Who Should Buy This
If you want an expandable essential home backup solution that keeps core appliances running for long hours, the Jackery HomePower 3600 Plus is an ideal choice.

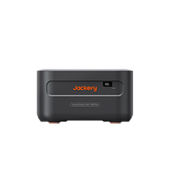
Jackery Explorer 5000 Plus Portable Power Station
The Jackery Explorer 5000 Plus Portable Power Station is an essential home backup solution that can run core household appliances during an outage or blackout. It boasts a massive battery capacity and supports dual voltage, allowing you to power a wide range of appliances, from small to heavy-duty, that operate at both 120V and 240V. It also features a pull rod and double wheels for easier transportation wherever you go.
Appliances Working Hours
- Refrigerator (300W) = 12.2H
- Microwave (1000W) = 4.1H
- Coffee Maker (800W) = 4.8H
- Washer Combo (2000W) = 2.1H
- Dishwasher (1500W) = 2.8H
Who Should Buy This
The Jackery Explorer 5000 Plus Portable Power Station is a home battery backup that can run most household appliances for hours. It's ideal for anyone looking for complete peace of mind during power outages.

Customer Review
“Exactly what we needed to power our home. Especially nice to have a 240-volt option to run the well pump. Also nice to be able to "accessorize" as finances allow.” — Richard Wamsley.
Battery Voltage Chart FAQs
What voltage is considered a bad battery?
A healthy, fully charged 12V lead-acid battery should rest at about 12.6–12.7 volts at 25 °C. If the resting voltage falls to around 12.0 volts, the battery is deeply discharged and needs recharging. A rested voltage near 10.5 volts usually means the battery has a shorted cell and is no longer usable. Under load, 10.5 volts is the typical cutoff point for many devices, but that does not apply to resting open-circuit voltage.
What voltage is a 12V battery at 50%?
A 12V lead-acid battery is roughly 50% charged at 12.05V to 12.15V when the battery is at rest.
How to choose a new battery?
When selecting a new battery, check its Ah (amp-hour) rating. The physical size and terminal type are other crucial factors to remember. The popular types of batteries include lithium-ion and LiFePO4. They generally have a longer lifespan and can hold a charge for more time.
Final Thoughts
The battery voltage is a critical component that determines how much energy the battery can supply, its charge state, and the voltage needed for certain electronics. Understanding the battery voltage charts will help you maintain the battery's performance, energy storage, and lifespan.
Different types of batteries require different voltage charts.
If you are looking for a safe charging solution that can power most of your home or outdoor appliances, you may trust the Jackery Solar Generators. They feature NMC or LiFePO4 batteries along with an all-round safety mechanism to protect the equipment being charged.


Hi,am using 24v system for my fridge so at night i have to switch it when it is 24.10 but sometimes when i check is already 22.8 but when i switch fridge off it goes to 24.8 or 7 so i dont understand this at all,am i killing my batteries?GEL batteries.
Leave a comment